How to hunt down shares that are leading the market recovery

It might be a bit soon to say the market is properly recovering from last year’s sharp slide, but some stocks have rebounded strongly in 2019. And for others, the correction last year hardly dented their price momentum at all.
In these kinds of choppy conditions, one screening strategy that offers an interesting perspective on the market is the 52 Week Highs list. After a spell of downward pressure, it acts like gauge of shares that are bouncing back fastest.
Most investors take a passing interest in the stocks that are hitting new highs. It’s the kind of data that can be found in newspapers and on financial websites everywhere. But what makes the 52 week high such an interesting datapoint is the psychology behind it. A couple of decades of academic research has shown that ‘new highs’ can provoke all sorts of irrational behaviour in investors...
So whether you’re interested in price momentum and new highs or not, just knowing about this irrational behaviour might give you a more objective view about how the market reacts to 52 week highs - and how to profit from them.
What lies behind the 52-week high?
On its own, the 52 week high is a pretty static number. Yet research shows that stocks hitting new highs often drift higher in price over the following weeks and months.
This upward trend is called “post earnings announcement drift”. It’s an academic name for when investors only slowly buy shares that are already trading around new highs. When earnings news about these kinds of share is published, particularly if it’s a positive earnings surprises, prices can be slow to react (as market efficiency momentarily goes out the window).
This confused reaction is caused by what the psychologists Amos Tversky and Daniel Kahneman called anchoring-and-adjustment. The idea is that humans form an anchor, or a belief, using a reference point (like a share price). As new information comes to light (like new earnings news) they only adjust their beliefs slowly, before going on to buy the shares at even higher highs.
In investing, the idea of anchoring around events like 52 week highs and earnings surprises is thought to be a big contributor to the ‘momentum effect’.
In fact, work by academics Thomas George and Chuan-Yang Hwang found that the 52 week high causes irrational pricing behaviour because of anchoring. As that behavioural brake is gradually released, the price drifts higher as momentum takes over.
Follow up research by the same team found that companies trading close to new highs and go on to deliver positive earnings surprises are particularly likely to experience post earnings announcement drift.
52 week highs and market conditions
Of course, in bearish conditions, when investors suddenly become risk-off and share prices fall across the board, a 52 week high strategy will be vulnerable. As the chart below shows, the market slide last year killed momentum in the 52 week high stocks that were in the portfolio at the time. As a result, it saw a -6.5 percent loss over the past 12 months - although it’s up 8.0 percent on a two year basis.
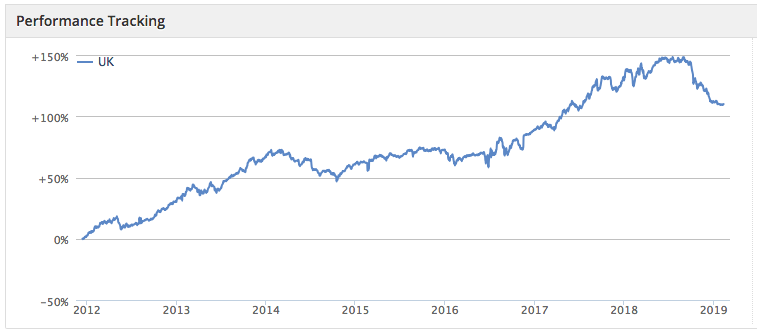
But when markets start to recover, this screen is one of the first to show which stocks have withstood the decline and are recovering quickest.
Here are some of the companies currently trading around their 52 week highs at the moment. The classic 52 Week Highs screen is here, but this take on it offers more details on the profiles of the stocks on the list, including their StockRank Styles and RiskRatings. Of around 50 stocks trading close to new highs (excluding financials), this is the top 10:
Name | Mkt Cap £m | Percent vs. 52w High | Value Rank | StockRank Style | Risk Rating | Sector |
1,783 | -0.055 | 58 | Style Neutral | Conservative | ||
72,642 | -0.40 | 17 | High Flyer | Conservative | ||
18,201 | -0.40 | 16 | High Flyer | Conservative | ||
5,824 | -0.52 | 84 | Super Stock | Adventurous | ||
50,292 | -0.72 | 15 | High Flyer | Conservative | ||
5,691 | -0.73 | 10 | High Flyer | Conservative | ||
760 | -0.77 | 27 | High Flyer | Conservative | ||
2,419 | -0.82 | 28 | High Flyer | Balanced | ||
176.4 | -0.91 | 54 | Turnaround | Balanced | ||
91,832 | -0.95 | 65 | Super Stock | Adventurous |
There is a fair spread between industry sectors here, with a couple of cyclicals, a couple of defensives and the rest ‘sensitives’. But the RiskRatings - which are our measure of medium term price volatility - point strongly to more Conservative, lower-vol names leading the market.
We used a minimum market cap filter of £25 million to remove very speculative names, but these are mainly large and mid-cap stocks. There’s also a “quality’ theme in here, which shows up in six of the top 10 being high “quality + momentum” High Flyers.
These stocks have the feel of safer, more predictable plays of the kind that soak up investment flows in periods of heightened uncertainty. Certainly the valuations of some of these names, based on their Value Ranks, could be seen to be fairly expensive.
So generally, it’s worth remembering that while the 52 week high seems like quite a straightforward measure, it’s actually got some interesting psychology behind it. The market tends to be wary of bidding up the prices of stocks hitting new highs - but this can actually cause their prices to drift higher over time.
Right now, this quick exploration suggests that the highest new highs are tending to be found among larger, more conservative and higher quality firms. But that could easily change if the market becomes more risk-on later in the year.
Recognising the likelihood of anchoring in the market - especially as a potential driver of momentum - is useful. Just by knowing that events like 52 week highs can cause irrational pricing means it’s possible to choose to avoid them altogether or use the ‘new highs’ strategy to spot new trends.
Disclaimer
This is not financial advice. Our content is intended to be used and must be used for information and education purposes only. Please read our disclaimer and terms and conditions to understand our obligations.

8 comments
Hi Ben - Great article. I agree there is nothing intrinsic about stocks reaching 52 week high points. It's the psychology and herd instinct that causes the momentum. But that is not to disparage the phenomenon. Smart investors use it to their advantage.
Mark Minervini has often said that his biggest winners came out of stocks breaking out of the 52 wk high. But that happens only when we are really motoring from a bear market to a solid bull environment.
My example below underlines this point. The tabulation is a back testing of all LSE stocks (except miners and oilers) on 14/1/19 that were between 98% and 99.9% of a 52 Week High. It then shows their share price movement a month to date. Not exactly encouraging. This is against the backcloth of a stock market that at best can be described as moving sideways during that period. So timing is everything. You need to wait for the bull run to really get going before this strategy produces the returns that MM talks about.
Actually the Allshare index was up about 4.5% in the last month, so that is pretty good, that is about 60% pa? So even more surprising that the new highs have rarely followed upwards. I think with the uncertainty over Brexit investors are taking profits sooner than they would usually.
Post earnings announcement drift is not constrained to only stocks reaching their 52 week high, it can apply anywhere on a chart. Also as we all know anchor points do indeed have some effect on share prices, but again this is not constrained to 52 week highs, it is apparent at levels of support and resistance, although, granted, some are stronger than others and as such become stickier.
The key point here is that in order for a share price to progress it needs to break a 52 week high, this is obvious and is equally obviously very common, there is no magic or science in this, it is simply what happens, as it does for resistance levels deeper in the chart, although these are rarely reported academically because they are harder to spot within a general study driven by mathematical historical data.
Hi Ben, great post. I am a breakout trader / swing trader so often trading stocks that are around their 52 week highs or breaking out to new highs. You commented the strategy has been harder recently, I somewhat disagree. My reason being is that institutions are always looking for the sector that will outperform the market. If we can identify their favoured sector and trade the best stocks within that sector we should be able to profit. I agree that during a correction or bear market there will not be as many 52 week high trading opportunities.
The Stockopedia sector analysis makes it very easy to identify which sectors are performing best on a relative strength basis.
Best,
Jack
HumourMe have you considered using the 50d and 200d moving averages to determine a trend. The problem is that the ones with the steepest moving average are likely to collapse back.
IOf wqe have had the fall then the recovery has already happened but not sure we have yet.
Most certainly. The screen I linked to contains this as an additional criteria. The Minervini trend template works well too, especially if it is a bull market. At the moment I use 50d/150d exponential moving averages in their place.
I'm increasingly of the view that low risk entries are key, for me. I like using Parabolic SAR (0.01, 0.2) and Heiken Ashi candles to keep me on the right side of the trade. They need to be aligned. With a low risk entry, there is an opportunity for a tight initial stop (or should this be reversed?). When the SAR gets ahead of the 50d ma I start using the SAR as the stop. If the SAR is above the 50d ma I should pass on entry. When the SAR is declining, in the context of higher highs and higher lows, I can potentially track my entry price lower using a buy stop order, adding to the position on a breakout. All experimental at the moment.
Another great article which has prompted me this morning to double my holding in John Laing (LON:JLG). John Laing is a rare case of a value share passing Can-Slim growth and 52 Week High momentum screens. A good example of PEAD and anchoring-and-adjustment as the company continues to win overseas bids and beat previous expectations?
In relation to Volatility I suggest <40% as a screen metric. As though ever please DYOR. Ian
Modifying '% from 52w high' to take account of volatility, ensure real 'trending' is going on and '% from 52w high' is not just a random fluctuation in price, requires something like this (it is a work in progress):
It can be modified for shorter time periods but is restricted by only having 52 week high/low to choose from.
It would be really nice, if in addition to 52 week high/low, we also had 6m, 3m & 1m high/low and also importantly, days since event. We could then ensure that events happened in the correct order. We could also screen for consolidation periods using combinations of the above.
Here is a link to a more fleshed out screen than the snippet above https://www.stockopedia.com/sc...