How to hunt for hidden quality on AIM

The Alternative Investment Market has been storming ahead over the past year. But there’s no hiding from the fact that 46 of its companies went bust or otherwise failed in 2016. That flow of disappointments is a reminder of just how risky AIM can be.
AIM is London’s junior market for (mostly) small growth companies. Last year the All-Share index rose by more than 14.3%, and it’s up around 25.3% in the 12 months to date. That was enough to outpace most of the main London indices.
But while the performance was strong, other statistics are troubling. For a start, the number of companies on AIM has been falling for nearly a decade. Back in 2007 there were 1,694 stocks on the index. But that was down to 982 by the end of last year.
For many years, commentators have blamed this on evolution. They argued that low quality junk was slowly drifting away, and everyone would benefit. True perhaps, but with less than 1,000 companies some are starting to worry.
Unsurprisingly, the worriers include small-cap brokers. The number of nominated advisers (nomads) that advise and oversee AIM companies has fallen from 50 to 36 since 2013, according to Stockdale Securities. Those that are left are competing to advise fewer and fewer companies. It would be a fair guess that mid-market accountants and advisers are uneasy as well.
Not all bad news
For investors, though, the falling number of AIM companies is both good and bad news. Research by accountancy firm UHY Hacker Young shows that 105 companies left the market in 2016. Forty-six of those delistings were caused by financial stress or strategy failure. That’s a stark warning about the risks of investing in AIM shares.
But on the upside, one of the side-effects of the devaluation of sterling last year was that UK companies became more attractive to foreign buyers. UHY say that 34 companies were acquired from AIM in 2016, up from 28 a year earlier. Among them were big premium M&A deals like the takeover of Avesco by America’s NEP and the ongoing bidding war for Lavendon.
In summary, the two main reasons for AIM delistings are at polar opposites when it comes to investment desirability. The conclusion is that while poor quality firms continue to die off at a high rate, good quality companies can be found on AIM - and the payback from them can be high.
So how do you find quality?
Broadly speaking, the best quality companies are profitable and generating sustainable cash flow? at high rates of return. At Stockopedia, we score and rank every share in the market against a range of ‘Quality’ financial measures that take these factors into account. It’s called the Quality Rank.
But the problem with focusing on quality alone is that the market knows a good quality company when it sees one. That means that high quality companies can end up on rich valuations. Take a look at the following snapshot of the highest Quality Rank shares on AIM*. You’ll see that the Value Ranks (which rank shares based on a range of valuation measures) are low. So these are generally showing the signs of being potentially good quality but pricey stocks. That will suit some, but not others.
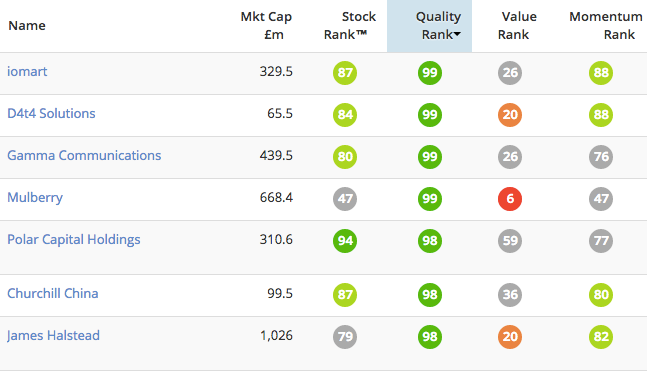
* With a maximum spread of 5% and a market cap higher than £50 million.
Another way to use quality, is to blend it with other factors like value and momentum. In other words, look for stocks that are good quality but more attractively priced (and with a positive price trend). Stockopedia does this with the StockRank, and sorting AIM this way gets a different result:
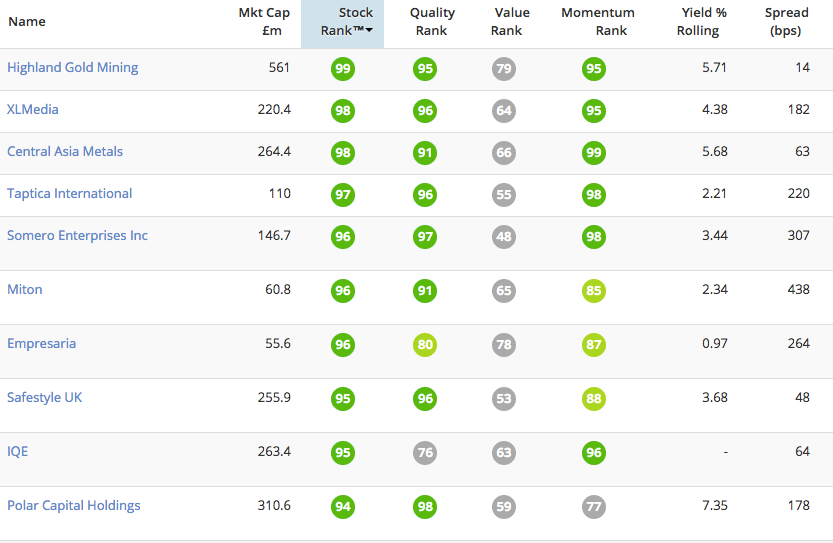
The list shows that quality and momentum are the driving forces behind the highest StockRank AIM stocks at the moment. Across the board, the Value Rank is the weakest component, which is what you might expect in a market that has risen strongly in recent months.
What you get by introducing value, though, is an insight into where there might be mispricing, as well as stocks that investors are sceptical of. The top four shares, for example, are two mining companies and two Israeli media/marketing businesses. Investors are wary of them and there have been problems with these sorts of companies in the past. But others on the list are far more familiar. So this is really a starting point rather than a final destination when it comes to research.
On a more general note, it’s worth saying that there are no failsafe rules that will avoid disasters among the sorts of smaller companies found on AIM. By definition, limited financial resilience means they can be hit hard by unexpected events.
The makeup of AIM has changed a huge amount over the past decade. Mining and oil & gas stocks now represent a much smaller proportion of the market. Meanwhile, the focus of attention has switched away from speculative sectors towards industries where it’s easier to judge the potential quality of an investment. Hopefully that will result in more success stories.
Stockopedia members can check out the full High Ranking AIM Shares screen here. If you’re not a member, you can always take a free trial).
Disclaimer
This is not financial advice. Our content is intended to be used and must be used for information and education purposes only. Please read our disclaimer and terms and conditions to understand our obligations.
8 comments
Interesting.
Good
Interesting.
It is very good: a practicle way to invest in profitably in smaal caps.
Point of information. LVD is fully listed.
The Stockopedia ranks clearly demonstrate that on average shares in the AIM All Share Index are more expensive, of lower quality, have lower momentum and growth than fully listed shares in the FTSE All Share Index. A randomly selected portfolio of AIM shares is likely to contain a higher proportion of expensive junk shares and the investment returns are more likely to be disappointing.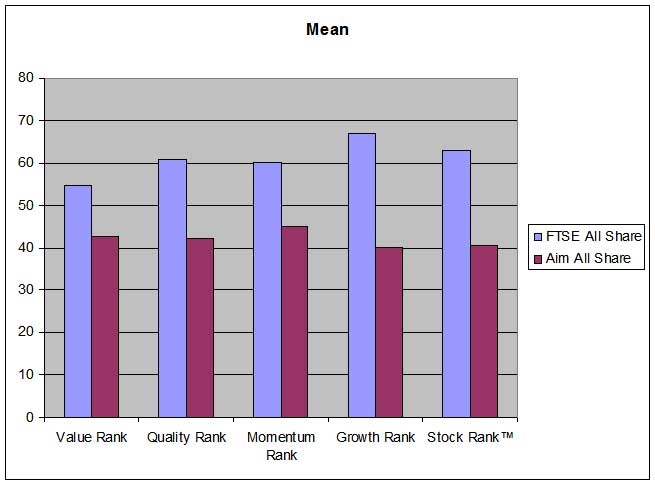
However, I think the ranks also give us some hope that AIM could be a fruitful place to invest. There is a stark difference between the two markets in the contribution each individual rank makes to the overall Stock Rank. This chart below shows the correlation between the individual ranks and the Stock Rank. The Stock Ranks of the fully listed shares are mainly driven by momentum and quality but for the AIM shares quality is the strongest contributor with Value, Momentum and Growth (not a component of the Stock Rank) of equal importance. Contrary to Ben's statement, when the whole of the Aim all Share index is considered, there is a weak positive correlation between quality rank and value rank which means that higher quality shares on Aim tend to be cheap. The implication is that the Stock Rank system is more likely to be successful in the long term when applied to AIM shares than it is when applied to fully listed. If you hack the url of the performance graphs as suggested by Ed, the outperformance of the top StockRank decile in the £10m - £100 m market cap group compared to the >£1000 m is impressive, which tends to support these observations.
That's interesting but not really surprising. Do you have any figures for the AIM100, I know a lot of the companies in that and regard many as are being decent companies. Some often come up in NAPS or other Stockopdia screens. Or others have been very successful recently such as Boohoo.Com (LON:BOO).
Sorry, I haven't analysed the AIM 100 separately.