When it comes to different approaches to the stock market, fundamental analysis and technical analysis are often seen as two completely separate disciplines.
With fundamentals, the focus is on stock selection and using data to uncover a company’s strengths and weaknesses. From there you can take a view about valuation and make predictions about the future.
With technicals, the starting point is that the market has priced-in everything there is to know about a stock. From there, it’s all about using different techniques to predict where the share price will move next.
At first glance, it’s easy to see these two tribes as following very different paths. But the truth is that investors on both sides borrow ideas from each other.
Some technical traders, for instance, won’t open positions in stocks without strong growth trends that only show up in financial statements. Likewise, many stock-picking analysts wouldn’t dream of buying a share without seeing strong trend confirmation on a price chart.
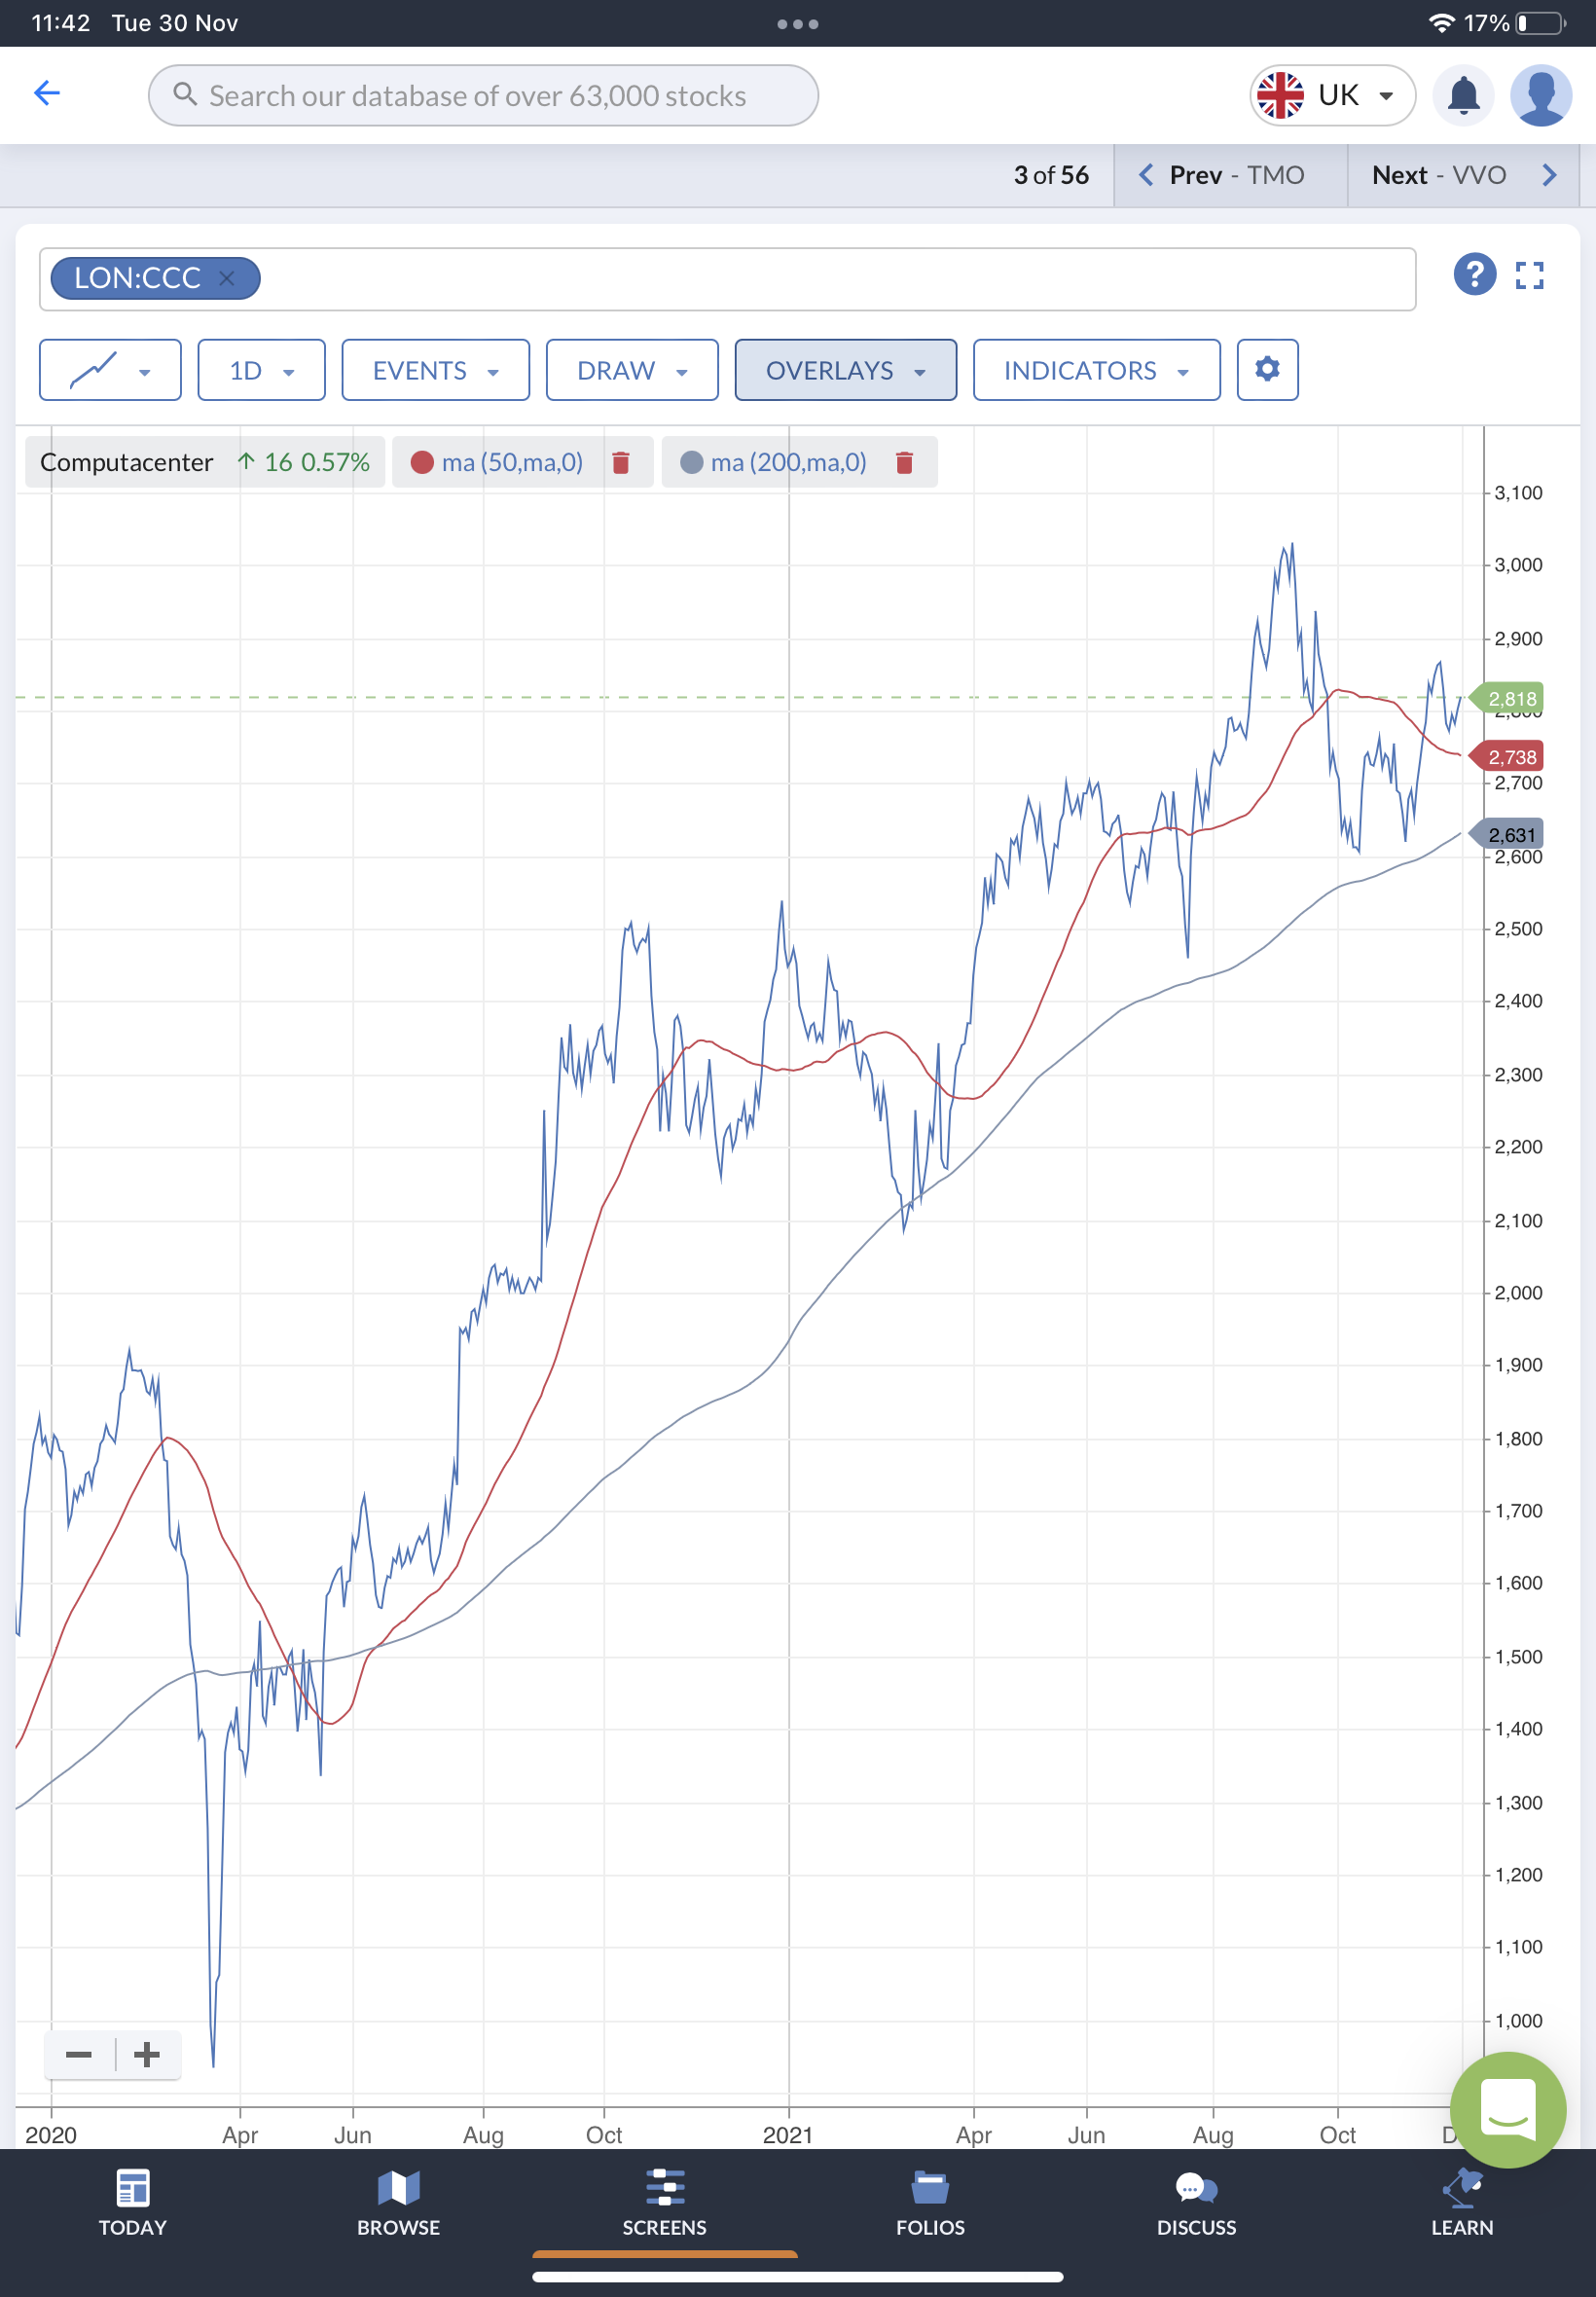
One technical measure that comes closer than most to transcending these disciplines is the Moving Average.
On one hand, the MA is capable of being used in sophisticated technical strategies. But on the other - and this is important for regular investors - it can be put to work very easily to tell you a lot about sentiment and trends. These can be useful signals when it comes to timing trades and detecting when trends are changing.
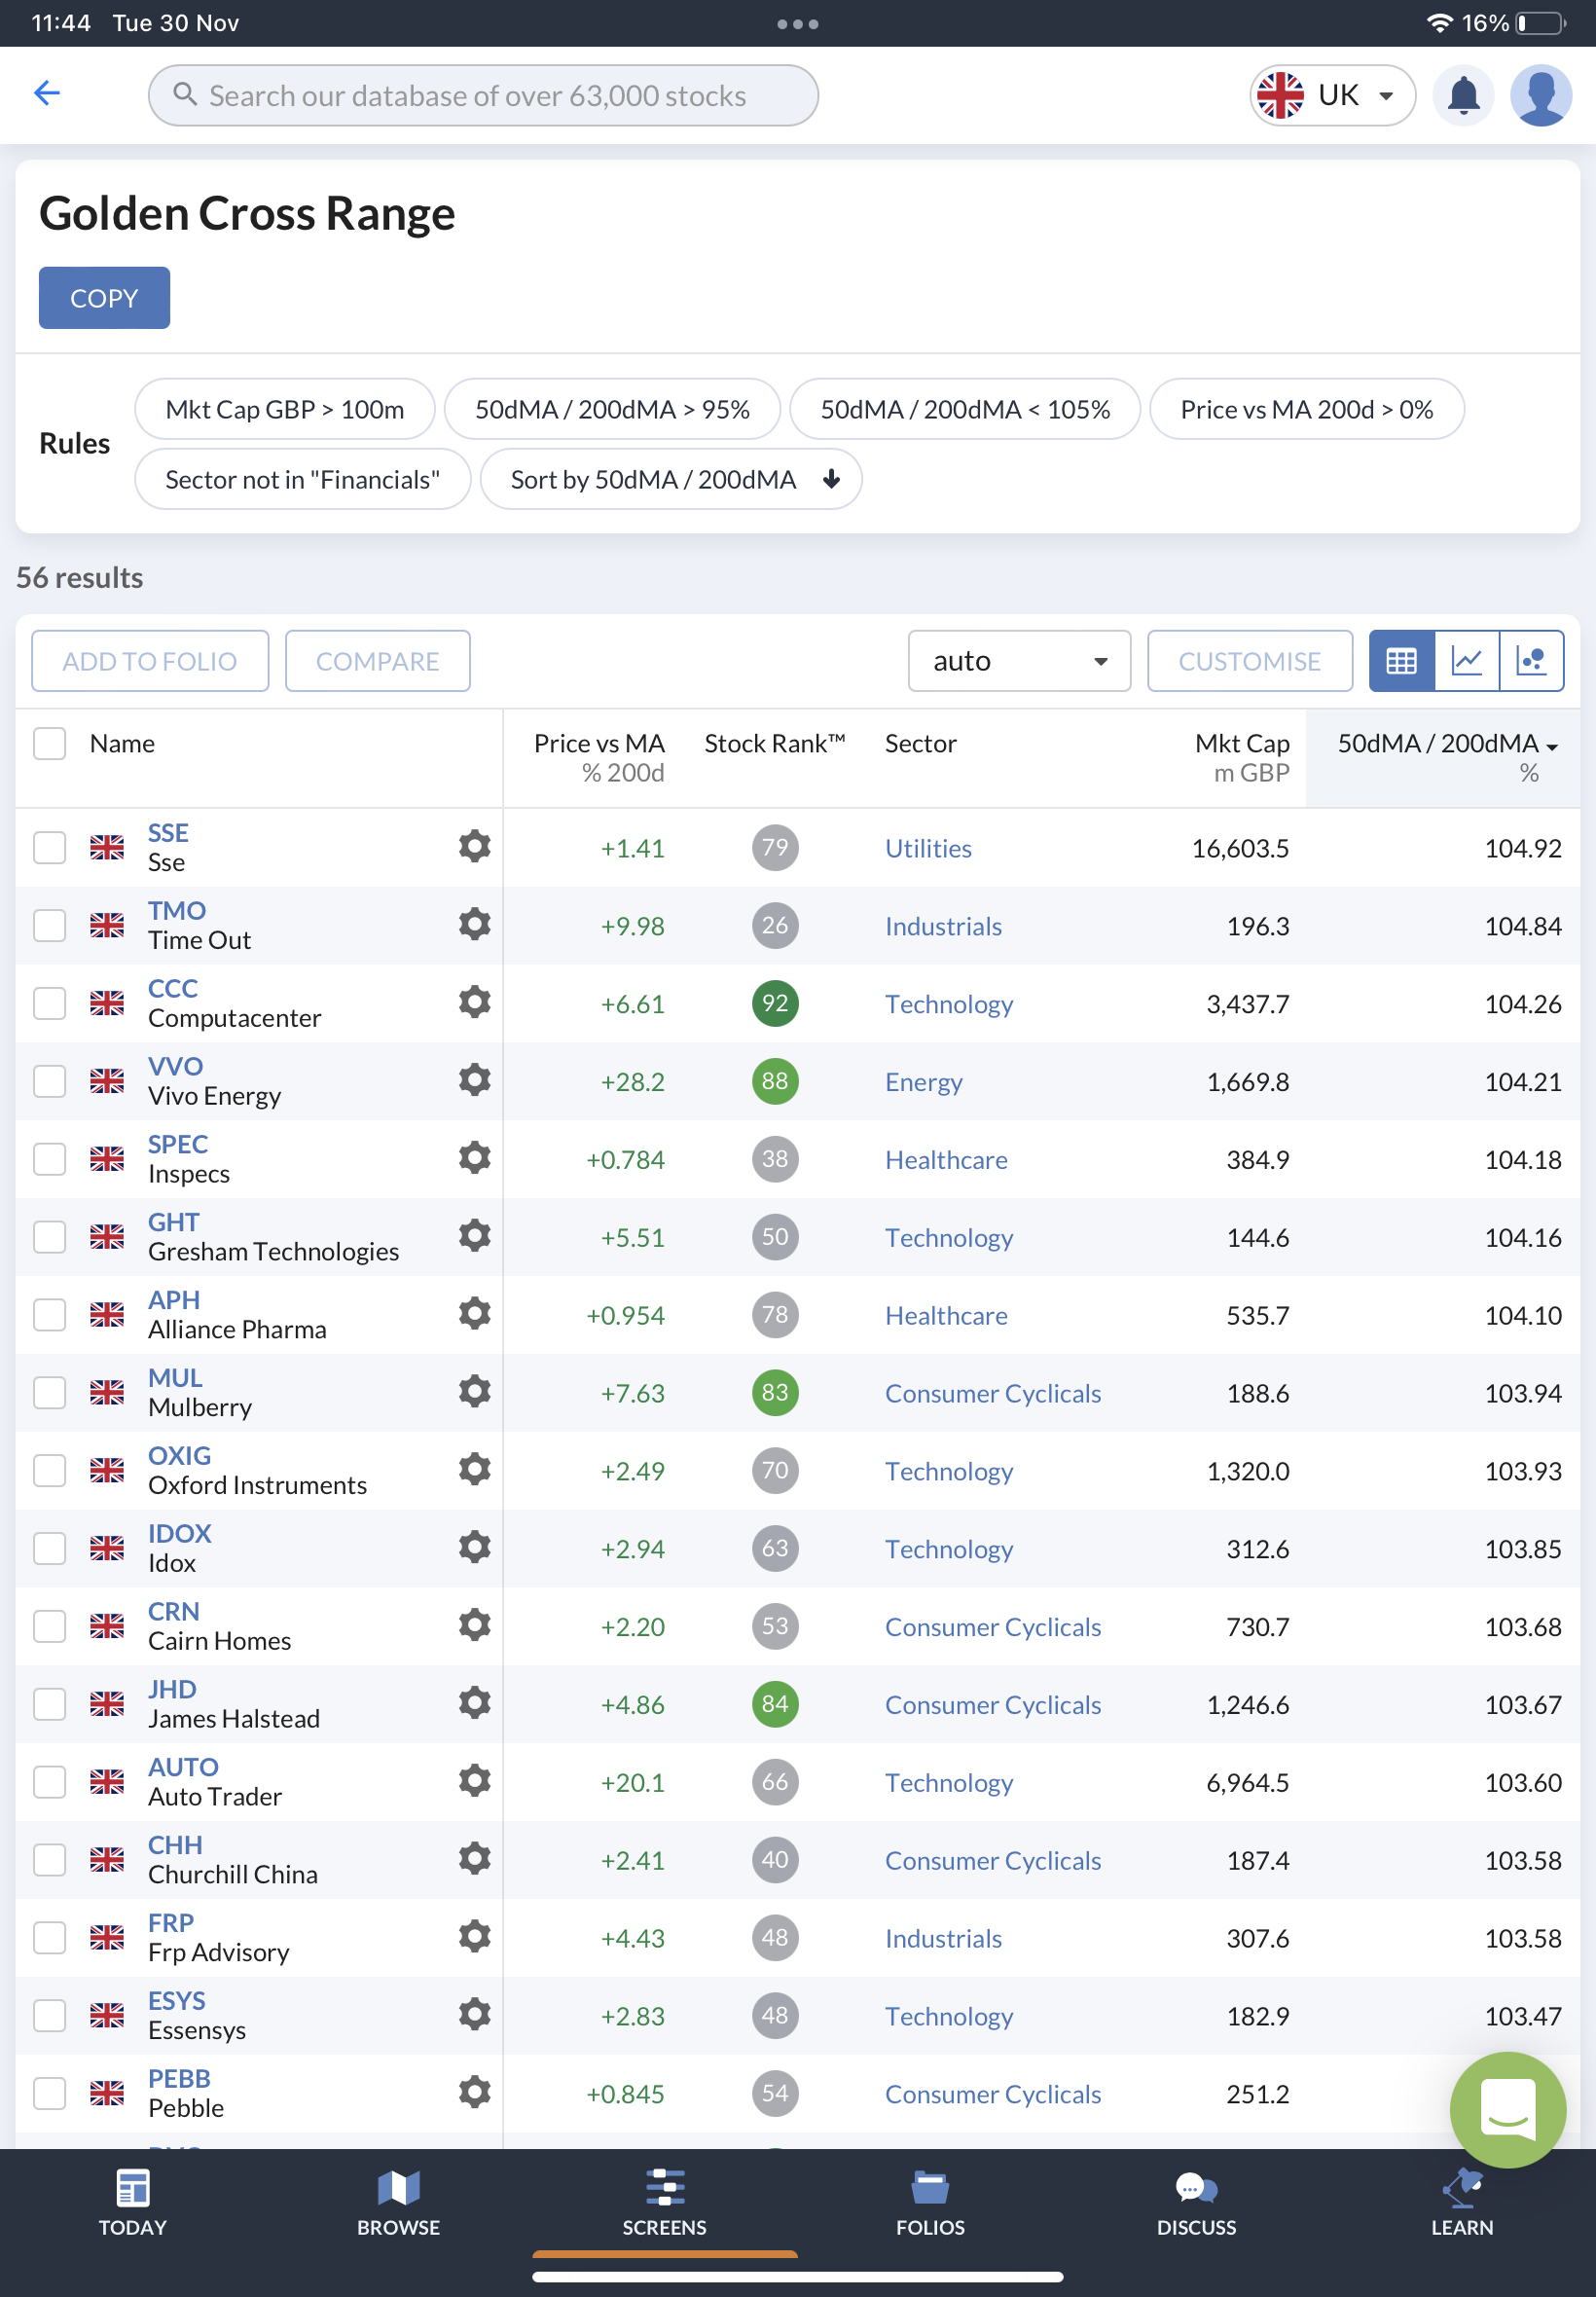
In this article, we’re going to look at how you can do that (without even using a chart), and how to screen for stocks in bullish trends, including the all-important Golden Cross.
What are moving averages and how are they used?
Take a look at a stock chart over any timeframe and much of what you’ll see will be the noise and volatility that naturally push and pull on prices. What might not be so obvious is the underlying trend in the price. Is the stock on the up or is it falling out of favour?
Price trends over varying time frames are important to investors for different reasons. For some, trends can help determine areas of ‘support and ‘resistance’ in prices. But for others they can simply be an extra confirmatory signal about what the market really thinks about a share.
Moving averages reduce noise and let you see the trend. They work by plotting the average share…