Introducing the New Pension Deficit Ratios

Runaway pension deficits have long been a problem for equity investors. In this age of low interest rates and long lived work forces the problem is exacerbated further still. Many plans now struggle to earn the returns they need to stem the flow of operating profits into the so called ‘pension black hole’. Many investors have stressed the impact they can have so it is important that we have a way of assessing them.
As you (hopefully) all know by now, at Stockopedia our mission is to take the pain out of this kind of process so we’ve come up with a new set of ratios to make this as easy as possible for you. So, allow me to introduce...
The New Pension Deficit Ratios
Pension Deficit
What does it tell me?This is simply the value of the pension deficit or surplus on the company’s group level balance sheet. A positive value indicates that there is a deficit - i.e., that the pension is underfunded. A negative value therefore indicates the opposite - that there is a surplus.
A neat trick with this metric in the screener is to combine it with other ratios via the ‘Ratio vs. Ratio’ rule builder. This allows you to compose your own pension deficit ratios and compare a deficit against sales or tangible assets, for example.
How is it calculated?It is quite simply the value of the deficit or surplus as displayed on the company balance sheet.
Where can I find it?You can find the metric in the screener under the name ‘Pension Deficit’. You can also find this figure on our balance sheets as a component of ‘Other Liabilities, Total’:

Pension Deficit to Market Cap
What does it tell me?This metric is intended to give a sense of the scale of the pension deficit relative to the market capitalisation of the company. Due to the seniority of pension liabilities over other forms of debt and equity, a large pension deficit can prove especially troublesome for equity investors.
If there is a deficit, then it must be paid off somehow and there are only two options available to a company. Either sufficient returns are earned on plan assets to close the gap, or contributions are made from operating profits at the expense of shareholders. Generally, the latter of these two options is how things play out so it is critical to keep an eye out for an oversized deficit.
This ratio states the size of the deficit as a percentage of market capitalisation so the higher the figure the worse the deficit is. Ideally the metric would be negative (indicating a surplus) and should the metric start to creep into positive double figures then it’s probably time to take notice.
How is it calculated?The ratio is calculated by taking the group level pension deficit (or surplus) from the balance sheet, dividing it by the market capitalisation of the company and then multiplying by 100 to get a percentage figure.
For example, if a company has a pension deficit of £10m, and a market capitalisation of £100m, then the pension deficit to market cap ratio would be (£10m / £100m) * 100 = 10%.
Where can I find it?You can find the metric in the screener under the name ‘Pension Dfct / Mkt Cap’.
Net and Gross Gearing Inc. Pension Deficit
What do they tell me?Gearing ratios are used to get a sense of the level of indebtedness of a company. They show the amount of debt a company has relative to its equity, expressed as a percentage, and are a commonly used indicator of financial strength.
Highly geared companies are considered riskier as a given fall in gross income will have a more pronounced impact on the bottom line for a geared company than its ungeared counterpart. This is because a larger proportion of expenditure is fixed in the form of interest payments.
This new ratio shows the exact same thing but it takes account of the size of the pension deficit in computing the metric. This helps investors to get a better sense of just how leveraged a company is once you account for its pension deficit. As with the ordinary gearing ratios, we provide both a net and gross version of the gearing ratio inclusive of pension deficits.
How is it calculated?The gross gearing ratio including pension deficits is calculated as long term debts plus pension deficit, all divided by equity and multiplied by 100.
The net gearing ratio including pension deficits is calculated as long term debts plus pension deficits, less cash and short term investments, all divided by equity and multiplied by 100.
Where can I find it?You can find the gross gearing ratio including the pension deficit in the screener under the name ‘Gross Gearing inc Pension Dfct %’ and you can find the net gearing ratio including the pension deficit under the name ‘Gearing inc Pension Dfct %’.
Additionally, for both of these metrics, you can now find them on the StockReport in the ‘Other Ratios’ section, to the right of the ordinary gearing ratios:
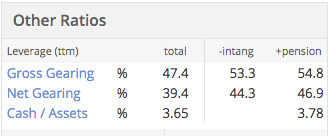
Note that the ‘+pension’ column shows the value of the ‘total’ column once pensions have been accounted for and does not also include the effect of the ‘-intang’ column.
Screening and Table Views
As mentioned for each ratio above, you can find all of these new metrics in the screener. Just to make things easy, I’ve prepared a dummy screen for you to help you out in finding them. I’ve also demonstrated how to use the pension deficit figure as part of a ‘Ratio vs. Ratio’ rule.
Feel free to duplicate it for yourselves, though please bear in mind that the rules are quite arbitrary! It is intended purely to show you how to find all the new ratios and not at all as a working screen.
In addition to the screener however, you can now add all of these metrics to your portfolio holdings page. You can make use of the table editor feature (there’s a video on that here) to do this. You’ll find these new ratios under the Financial Strength section though the pension deficit figure itself lives in the Balance Sheet section:
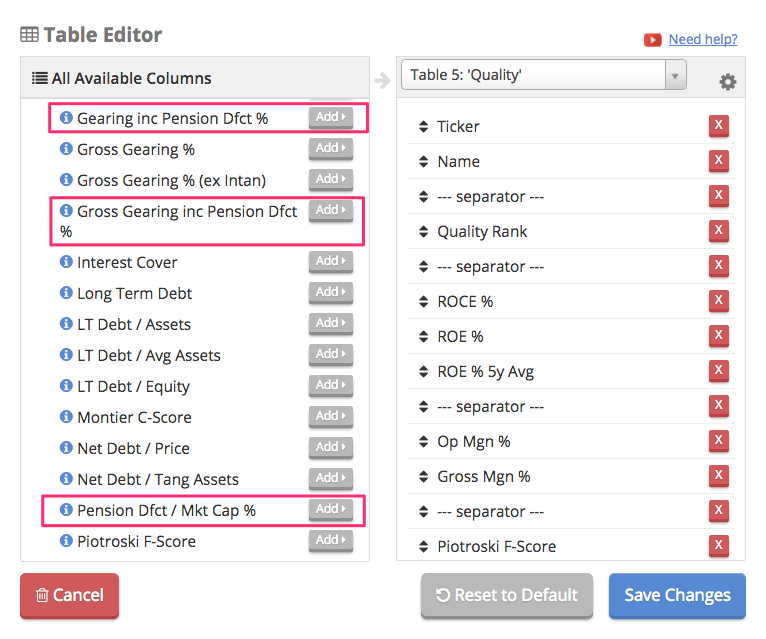
Adding the metrics to your portfolio holdings page gives a really easy way to quickly assess the health of your portfolio according to your favourite metrics so do give it a go.
In Conclusion…
These ratios are something that the community has been asking for for quite a while so we’re delighted to be able to offer them to you. To help you get the most out of it, I've also prepared a video for you which goes through all of the new data and where to find the various parts of it on the site.
If you need help understanding them or have any suggestions then feel free to send me a message using the support button at the bottom right of the screen. I’ll get back to you as soon as I can to help you out. Happy hunting for now!
Disclaimer
This is not financial advice. Our content is intended to be used and must be used for information and education purposes only. Please read our disclaimer and terms and conditions to understand our obligations.
36 comments
These are useful, but gearing can confuse matters.
Hogg Robinson (LON:HRG) is an odd example as adding pension deficit 'improves' gearing as it moves increasingly towards the negative.
Negative gross gearing (Total Debt / Book Value of Equity) in this caseis the result of a negative 'Book value of equity' http://www.stockopedia.com/share-prices/hogg-robin... not net cash (as is possible with net gearing).
Can we have a 'book value of equity' filter in order to exclude these 'false negatives'?
Article in the Telegraph today where consultants JLT have produced a liabilities/MCap table for the 350, This is topped by First Group at 377% followed by IAG at 204%
http://www.telegraph.co.uk/investing/funds/the-dividends-at-risk-from-final-salary-pension-promises/
Tesco's report today emphasises two points I made earlier:
1} the growing lack of credibility of IAS19 - I pointed out that Carclo had to use bond rates even though its pension scheme had moved out of bonds and here is Tesco:
"To calculate the pension deficit for accounting purposes, we are required to use corporate bond yields as the basis for the discount rate of our long-term liabilities, irrespective of the mix of our assets and their expected returns. The sharp decrease in corporate bond yields since the year-end - the biggest six-monthly fall recorded since the iBoxx corporate bond index was first introduced in 2000 - has therefore driven a rise of more than 50% in the accounting valuation of our liabilities, increasing our reported accounting net deficit from £(2.6)bn to £(5.9)bn. Our defined benefit pension scheme assets have performed well and we are progressing with our asset de-risking strategy, which aims to reduce risks from changes in interest rates and inflation".
2) the effect on the balance sheet and its distributable reserves. Carclo had to stop its dividend payment. Tesco isn't paying one at the moment but look at the balance sheet - £1.9bn added to the pension deficit in the 6 months was enough to wipe out retained earnings.
Tesco (LON:TSCO) 's prelim report today shows a pension deficit of £7.16bn up from £3.2bn in Feb 2016, a whopping increase of 124%.
And yet the shares are up 12% at the time of writing this note. Why?
Well, the pension deficit issue is currently only a paper problem. The impact today is a weakened balance sheet. Net Assets have come down to £5.9bn from £8.6bn largely due to the increased pension deficit.
However, the annual deficit contribution has not changed. Tesco is due an actuarial scheme(s) revaluation in March 2017. It is at that time that the scheme trustees will take a hard look at the calculated deficit and re-negotiate a deficit reduction programme.
Today's market reaction is down to the better than expected operational performance. The massive increase in the pension deficit is potentially tomorrow's problem if the underlying economic factors haven't improved in the interim period.
Great feature!
This is a great addition to highlight some of the issues around pension deficits. A few thoughts from me...
Firstly, how are you handling schemes with a surplus that cannot be recognised (e.g. irrecoverable under IAS19)? Is this just displayed as a nil surplus/deficit?
Secondly, and by far a more important point; I think this needs to come with a substantial health warning around the basis on which this deficit is measured. You are looking at a single measure, i.e. accounting, which is typically not a particularly important measure. In reality, the employer's commitment to the scheme in terms of monetary contributions is based on the Technical Provisions deficit (i.e. the 'Scheme Funding' position required under SFO legislation). This measure will show significantly higher liabilities than on an accounting basis, and as such a lower surplus / higher deficit. Scheme Funding liabilities can easily be in excess of 20% higher than accounting liabilities.
There is also another potentially important measure that people should be aware of; the buyout deficit. This represents the hole that would need to be filled in order to 'get rid' of the scheme, i.e. to secure the liabilities with an insurer so that the company has no further obligation to pay / fund benefits. This is also the 'debt on employer' that would arise should the sponsoring company go insolvent. This measure is higher again! I've seen buyout liabilities that are double the accounting liabilities.
I think someone has already touched on the importance of having a measure of the total liabilities / assets as well as the deficit; I appreciate this may be difficult to implement, but this would be very valuable to allow the magnitude of the pensions risk to be considered. There's no hard and fast rule to estimate the liabilities on the other measures I've noted above, but having accounting liabilities would at least give a very high level indication of the actual size of the pensions issue.
By way of a very brief example...
Assets = £1,000m
Accounting liabilities = £1,000m
Deficit / Surplus (Stocko) = £Nil
Scheme funding liabilities = £1,300m
Scheme funding deficit = £300m
In this case; the accounting position looks relatively good, but in reality the company is required under legislation to make good the £300m Scheme Funding deficit. I've seen a real example of something very similar to this, and in that case the market cap of the company was only just over £100m... the company was essentially a 'pensions zombie', where the business was totally restricted by the weight of the pensions scheme.
For what it's worth, if people are interested in this stuff, you can often get a 'Scheme Funding' number by looking in the full accounts. For companies where pensions is a big issue, they will often disclose the deficit at the previous triennial valuation and a note on the contributions that they agreed to pay to make up this deficit. This may help to supplement the stockopedia screening tools.
Again, I think the new functionality is a great addition. This post isn't meant to be slating it at all, just highlighting that it's worth people having a bit more of an understanding of the various measures of pension deficits and how these play together.
Very happy to elaborate on things I've said / chat about this stuff if it's helpful!
The null value (" - ") seems to cause difficulty with using the new ratios as part of a screen. If you wanted to ensure screen results do not include any companies with a deficit of say 10% or more of market cap, then you would expect putting in a value of less than 10 in this ratio as a new screen 'rule' would do the trick. However, the screener then also filters out every stock with a null value as well - which, as has been pointed out, could mean the info. just wasn't there rather than that the stock does not qualify for the screen. Is there a way of fixing this quirk and/or adjusting the screen to get around this so that it shows stocks with the "-" null value as well?
I exported the 625 companies in the FTSE All Share index to a spreadsheet . I then excluded those with a null value of pension deficit/mkt Val %, a pension deficit of <1% and any cases without a stockrank. For the remaining 165 companies I performed a simple correlation analysis between ValueRank and pension def/mkt cap%. There is a weak (0.36) but positive correlation. There is a tendency for companies with a large pension deficit to have a higher value rank. I would anticipate that a high pension deficit makes a company less valuable rather than more, so this correlation is the opposite of what I would expect.
Two possible explanations for this anomaly spring to mind and there are probably more.
Perhaps the market is identifying the pension deficit and reducing the share price accordingly. Since the deficit is not included in the book value or enterprise value used to calculate the value rank, the "value" of the company is overestimated and the value rank is therefore too high. Alternatively, perhaps the market is over reacting to the pension deficit and reducing the price excessively, leading to the high value rank.
It is interesting to note that in this same sample there is a weak positive correlation between yield and value rank and a weak negative correlation between p/e and value rank. This is as expected and helps confirm the feeling that the pension deficit finding is genuinely anomalous.
Hi David - glad to see you're doing the data work! That relationship is what I would expect to observe however, as a high ValueRank indicates that a company is priced more cheaply than a counterpart with a low ValueRank.
As such, if you observe a positive correlation between the size of the pension deficit and the ValueRank, this does indeed suggest that a company becomes less valuable (is priced more cheaply) as the pension deficit grows. Does that make sense? My apologies if I've misinterpreted your point!
This same logic is what explains the correlations with the yield and PE metrics that you describe.
Tom,
Assume two companies with a book value of 2, CoA with a pension deficit of 1, CoB without a deficit.
If the share price is 2 then the p/b is 1 for both companies and all else being equal they will have the same value rank. However CoA has a large liability which should be subtracted from the book value leading to a corrected p/b of 2. Since the same market price buys less value, CoA should have a lower value rank than CoB.
In general, if all other factors are equal then a pension deficit should lead to a lower value rank.
However, in our observations it doesn't. In our simple example the actual market price of CoA would be lower because investors recognise the liability. Unfortunately, because the liability is not included in the calculation of the value rank, the company is awarded a spuriously high rank. Stockopedia subscribers believe it to be undervalued but there is no way of knowing whether this is because the market has over-reacted to the deficit, we have calculated the value rank incorrectly, or some combination of the two.
David -
I think there is a slight flaw in your logic. You say:
" However CoA has a large liability which should be subtracted from the book value leading to a corrected p/b of 2 "
My understanding is that a pension deficit appears under "non-current liabilities" in the balance sheet account. So a book value figure is net of a pension deficit. You seem to be subtracting it again.
Happy to be corrected.
I thought there may be a flaw! You are correct that the book value does include the pension liability so the value rank is allowing for this. The other factor used in calculating the value rank that could be affected by the pension deficit is the Enterprise Value used to calculate the Earnings Yield. It is not clear to me from the definition of EV whether this is included or not.
It is even more complicated than I thought. If you look at a company like Hogg Robinson, it has a negative book value of £50.5m largely due to the pension deficit of £258.3m. In the value rank calculation for this company p/b is greyed out as n/a, presumably because it is negative. I can't find an explanation of how the value rank is adjusted for factors that are n/a.
In my previous response I picked the wrong ratio to explain my point, overlooking the fact that book value already included the pension deficit. I will try again in simple terms.
From a value investor perspective a high value rank is a good thing for a company to have.
A high yield is considered a good thing, high yield has an observed positive correlation with value rank so companies with a high yield receive a higher value rank.
A high p/e is a bad thing, there is a negative correlation between high p/e and value rank so companies with a high p/e receive a lower value rank.
A proportionately large pension deficit is (presumably) a bad thing. There is a positive correlation between pension deficit and value rank so companies with a large deficit (bad) receive a high value rank (good).
This is the anomalous correlation that I have observed which I would like to explain.
.
Whereas the pension deficit/Mcap ratio may be useful to flag up a potential problem it can be a crude measure. IMHO what is more important is what the surplus/deficit is in relation to the scheme's total liabilities and what those total liabilities are in relation to the strength of the balance sheet. This is what I wrote in another place in relation to Communisis (CMS) which has one of the highest deficit/Mcap ratios and where there was fear of a Carclo style dividend cut:
In general the factors used to produce the pension scheme figures such as bond yields and life expectancy are not company specific. These are moving to increase liabilities at the moment and the crunch is that those movements go straight to the balance sheet. Hence what really matters is the size of the liability relative to the balance sheet. This is because if there is a 10% adverse movement, a company with a previously neutral (neither surplus nor deficit) pension scheme will now have 10% of the liabilities thrown at its balance sheet.
In the case of Carclo. whose dividend cancellation sparked this off, the pension scheme liabilities on the (3/16) a/cs were £197m. The retained earnings on the balance sheet were £23.5m. Hence a 12% adverse movement in liabilities has been sufficient to wipe out retained earnings and cut the dividend.
As for CMS, the liability published at 12/15 was £177.5m so a 12% adverse movement would take £21.3m off the balance sheet. Allowing for the £5.1m increase in H1, most of which was at the very end of the period, that would be £16.2m off retained earnings (at 6/16) of £50m which leaves CMS in a relatively much better position.
There is also, of course, the wider discussion on how the pension funds are calculated. The Carclo irony is that, whereas it is obliged to use bond rates in its calculations by IAS 19, its actual pension fund has moved completely out of bonds and is almost wholly in what they describe as 'Diversified growth funds'.
Hi - the only problem with plan liability (or asset) data is that it is much less commonly reported by Reuters so it is hard for us to compute metrics from it reliably. They are good with the deficit figure itself but the actual plan asset / liability figures are not as well covered.
It is a little frustrating but I'm looking into it to see what might be possible.
I understand your frustration. I found that the assets and liabilities of the schemes I quoted were not on the preliminary results RNS - I had to go to each company's website and search the annual report to find it deep in the notes to the a/cs.
Exactly...Reuters generally are only uploading the main financial statements and then making use of data in the notes to perform normalisations etc. There are quite a few companies which they have uploaded pension assets/liabilities but even for a large cap like BT, for example, they were missing it for a recent report.
Thank you for your analysis in your first comment, though, it is always very helpful to get a better idea of what people want out of the numbers and how they interpret them.
Have a good weekend for now!
What about using the deficit's 5- or 10-years volatility as a proxy? It mght even end up more informative than gross assets when estimating risk, as it captures to some extent the degree of liability matching in the scheme.
That's an interesting idea actually, thanks for that! You're right that this should provide some insight into how well liabilities were matched over the period in question, though skewed by cases where companies have had to contribute. Ideally, we'd like to see that liabilities were matched consistently and paid for out of plan assets only...do you agree? Will have a think anyway.
A lot of companies have a - in the pension deficit/mkt cap% field rather than a number. Does that mean zero, a null value because you don't have the data or could it be either?
Does a negative number mean a surplus?
Hi David - a '-' does indeed mean a null value which yes, means either the data is missing or there is no deficit reported on the balance sheet. Generall it is the latter of these two as Reuters are quite good at reporting the deficit number.
A negative figure does indeed mean a surplus as well. Hope that helps!
Would you be able to provide us with a 'Pension Rank'
What pension deficit / market cap % is the mean vs the global market?
What pension deficit / market cap % would put a company in the top 10 percentile (no or little deficit) vs the global market?
What pension deficit / market cap % would put a company in the top 20 percentile vs the global market?
Hi Tom -
Excellent addition to the Stockopedia toolkit. Many thanks. You have plugged a significant gap in making it easier to evaluate balance sheet strength.
I have complained a number of times in the past that companies paint a rosy picture in their financial reports about their balance sheet when in fact it is far from healthy.
My last post on this subject related to Norcros (LON:NXR). Here is the relevant sentence from the company's FY2016 report:
" The Group is in a sound financial position, with strong cash generation in the year. Following the £23.6m investment in acquisitions during the year, net debt at £32.5m (2015: £14.2m) represents pro-forma leverage of 1.2 times EBITDA. "
Well, we can now see in the StockReport under Other Ratios : Net Gearing 68.3% ; Net Gearing +Pension D. 185.3%
Not so sound after all.
Seems like useful information but is rather hidden away. Can it be seen in your folios? Even from the "other ratios" it's not clear what the pension deficit is, I would rather just see the amount in £m. Does this have any effect on the Stockranking figures and if not why not? Looking at Alumasc (LON:ALU) is quite interesting.
Hi Herbie,
You can add it in to a portfolio view using the table editor. If you've not used it before there's a video on how to do it here:
https://www.youtube.com/watch?v=65asrtG56h4
I've outlined near the bottom of the blog above where you can find the metrics to add in to your portfolio views, give us a shout in support if you're still not sure.
It does not impact the StockRanks because we haven't adjusted the ratios that they are based on. We've discussed how/if to take account of this in there but they're not something that we will change lightly. Every metric in there at the moment is in there because we have sound evidence to suggest that their presence adds value to the ranking process and we won't be adding anything new unless we have good evidence that doing so will improve their performance.
We suspect that deficit analysis could make a good addition to the QualityRanks but we'll see how it pans out!
Tom
Thanks Tom for explaining. I have added it to my portfolios but still feel it's rather hidden. I would rather see this in Stockreport with a traffic light indicator.
As for including it in the Stockranks I feel it is required because it can effect the share price so hence the value figures, maybe that why some shares look such good value on SR, I feel this is one area that SR could improve on, debt and pension deficits it does not seem to take into account enough.
I also note that the traffic lights have disappeared for the gearing now.
Point taken, it is a little hidden away currently...perhaps it would indeed be better as a traffic light. We'll have a think.
We do appreciate the comments (from many in the community in fact, not just yourself!) about the accounting for balance sheet strength in the StockRanks too. We are researching and reading to try and come up with something good...we're just hesitant to do anything rash when performance is already so strong.
Thank you very much for the feedback anyway, we always appreciated it :). Have a great weekend for now.
Tom
This is an excellent addition to the site, thank you Stockopedia. I also would like to have it on the Stock Report, if that is possible.
Thanks for the feedback! I trust you've seen the gearing ratios inc deficit on the StockReports already? We'd love to add more in but StockReport real estate is limited these days and we don't want to clutter them unnecessarily. Which deficit ratios are you most keen to see on there?
Tom
Hi Tom
Apologies for the tardy response but I had missed your reply. I think the ratios are great. Additionally, it would be great if the actual £m pension deficit figure appeared on the stock report. In an ideal world I would love to see it as a line item in the Financial Summary but failing that, maybe at the top of the screen underneath Market Cap, Enterprise Value and Revenue.
Personally, I am less interested in a ratio for screening purposes (although that is a very useful feature) and more interested in an "at a glance" sanity check for red/amber flags.
I agree its a great addition to the site and it would be good to have it on the Stockreport.
EV including Pension Defecit would be my preference.
Also EV to EBITDA where EV included Pension Deficit.
If it makes the StockReport too cluttered then a selection somewhere in your account settings to always include/exclude from the stockreport figures could be another option.
Then for screening & Table view Earnings Yield and EV/EBITDA (including Pension Defecit) I think would be key additions. I don't want to exclude companies with high pension deficits but I definitely want to adjust my measure of cheapness for these. Pension Deficit Adjusted Earnings Yield is going to be by far the best way of doing this in my opinion.
In an ideal world it would also be taken into account when calculating StockRanks but I guess that is probably quite hard to implement?
Point taken re the EV figures, people do sometimes include the deficit in there and we've talked about that in the office before.
We'll have a think about it. Out of interest, what is your take on how you'd incorporate the pension deficit into the earnings yield? Further, why do you think said method is a good way of assessing the impact of the deficit on valuation?
We have discussed trying to incorporate this into the StockRank and we're keen to explore ways to do it. It is a little more challenging than just basic ratios but it is certainly doable so we're considering how best/whether to do it.
Thanks,
Tom
Hi Tom,
Out of interest, what is your take on how you'd incorporate the pension deficit into the earnings yield? Further, why do you think said method is a good way of assessing the impact of the deficit on valuation?
Earnings Yield = EBIT/EV
EV = Market Cap + Net Debt
So PD Adjusted EV would become = Market Cap + Net Debt + Pension Deficit
Then all ratios that use EV can be recalculated using the adjusted EV.
Reason to include an adjusted EV is that Pension Deficits are liabilities that have to be met through earnings over the long term so are very similar to debt.
The issue is that companies can vary in their asset allocation & return assumptions so that deficit numbers are not perfectly comparable. It is still better than excluding these though and net debt itself can be misleading as companies window dress to varying degrees/ have different cash flow profiles and we accept those variances.
The general point is that there may be companies out there with a large pension deficit that are so lowly rated they make good investments despite the extra liabilities they have over a company without a deficit. It is better to have a continuous measure like adjusted Earnings Yield than a discrete one like an in/out screening criteria.
Hope that helps,
Mark
This is a great feature and yet again it saves me from having to dig around in the various financial reports.
I'm wondering how often is the deficit figure updated? Is it quarterly as the results are published?
I think if possible it would be helpful to have the 'Pension Deficit to Mkt Cap' on the StockReport somewhere.
I'd be interested to hear views on the questions ...
At what point does the deficit become an issue?
How can that be best expressed in a screener formula?
For example out of my 25 holdings it would appear 12 have no deficit (and no surplus), 10 have values for Pension Deficit to Mkt Cap of less than 2.5, and the three remaining have values between 10 and 13%.
Any feedback welcome
Thanks
Phil
Hi Phil,
Glad that you're keen on the new data, we hope it will come in handy for all of you in the future. The deficit data is available on every balance sheet (certainly for companies reporting under IFRS) so it will be updated with every new financial report. This means generally twice a year for UK companies and quarterly for many others. The ratios use the most recent balance sheet available (like all of our balance sheet ratios) but this still means for a UK company the figure can be around 7 or 8 months old before a new release (6 months between balance sheet dates plus one or two months for the new report to be released).
We'll have a look at whether we can fit any additional ratios on the StockReport, they are a little cramped these days though so we'll see!
With regards to your last couple of questions, I'm by no means an expert by my take on it would be this. The deficit becomes a problem when it needs to be filled with company operating profits. Further, it is a problem when a significant chunk of operating profits are needed to close the gap so we need a way of identifying when we’re in that position.
I think we can identify this in two ways, one by looking at the size of the deficit relative to the size of the company, and two by looking at the size of the deficit relative to how much it makes. If, for example, the deficit was a significant proportion of market cap, but was not too large relative to earnings then maybe things are manageable. Alternatively, if the deficit looked large relative to earnings but the company was large and asset rich then again, perhaps it is not an issue.
You could get an idea of this kind of thing by looking at the deficit vs equity, tangible assets, market cap, cash, net profit, sales… etc with a ratio vs. ratio rule though I’m hesitant to offer any hard limits.
The easy answer, from a quantitative perspective, is probably just to treat it as no different from any other form of debt and to take account of it when looking at gearing. In other words, apply your same financial leverage cut off as always but just use the figure with the deficit in there instead.
Hope that helps,
Tom