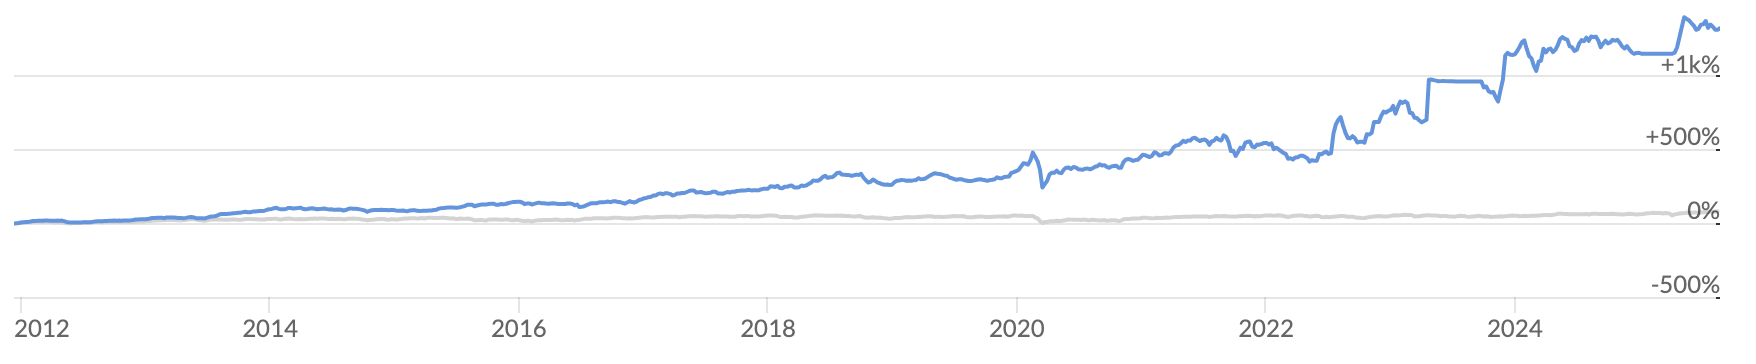
I recently wrote about Jim Slater and the evolution of his investment strategy from the 1960s through the 1990s. I was delighted by the thoughtful and challenging questions from erudite readers. The strategy has returned over 1300% since inception — a very solid result, particularly given recent market conditions. Naturally, the question arises: how has the screen achieved this result? In this article, I unpack the performance in detail by taking several lines-of-inquiry, including the following:
- How do we actually construct the portfolio tracked by the screen?
- How has the number of holdings in the screen changed over time, and what are the reasons behind those changes?
- How has the strategy performed on a year-by-year basis, and which stocks have driven these returns?
By the end of this article, you’ll have a clearer view of how the Slater screen ‘works’ and some practical takeaways for your own approach to stock picking.
How do we construct the portfolio?
In many ways, the chart reflects a hypothetical return. We do not invest real money and the chart does not reflect transaction costs, like broker fees. It is also worth noting that the screen does not generate a buy-list that can be copied directly into a portfolio. At the moment, the screen only produces three results — a woefully undiversified selection. The screen simply highlights stocks that meet the selection criteria outlined in Jim Slater’s books, The Zulu Principle and Beyond the Zulu Principle. In this sense, the screen is just a research tool; it streamlines the research process for investors who are following a specific investment approach — in this case, the Slater approach.
It’s worth reviewing the Zulu Principle rules.
- Slater PEG ratio: less than 0.75;
- Price-to-earnings (P/E) ratio: less than 20;
- Earnings per share (EPS) growth: greater than 15%;
- Relative strength (1 year): positive (> 0%);
- Return on capital employed (ROCE): greater than 12%;
- Market capitalisation: between £20 million and £1 billion.
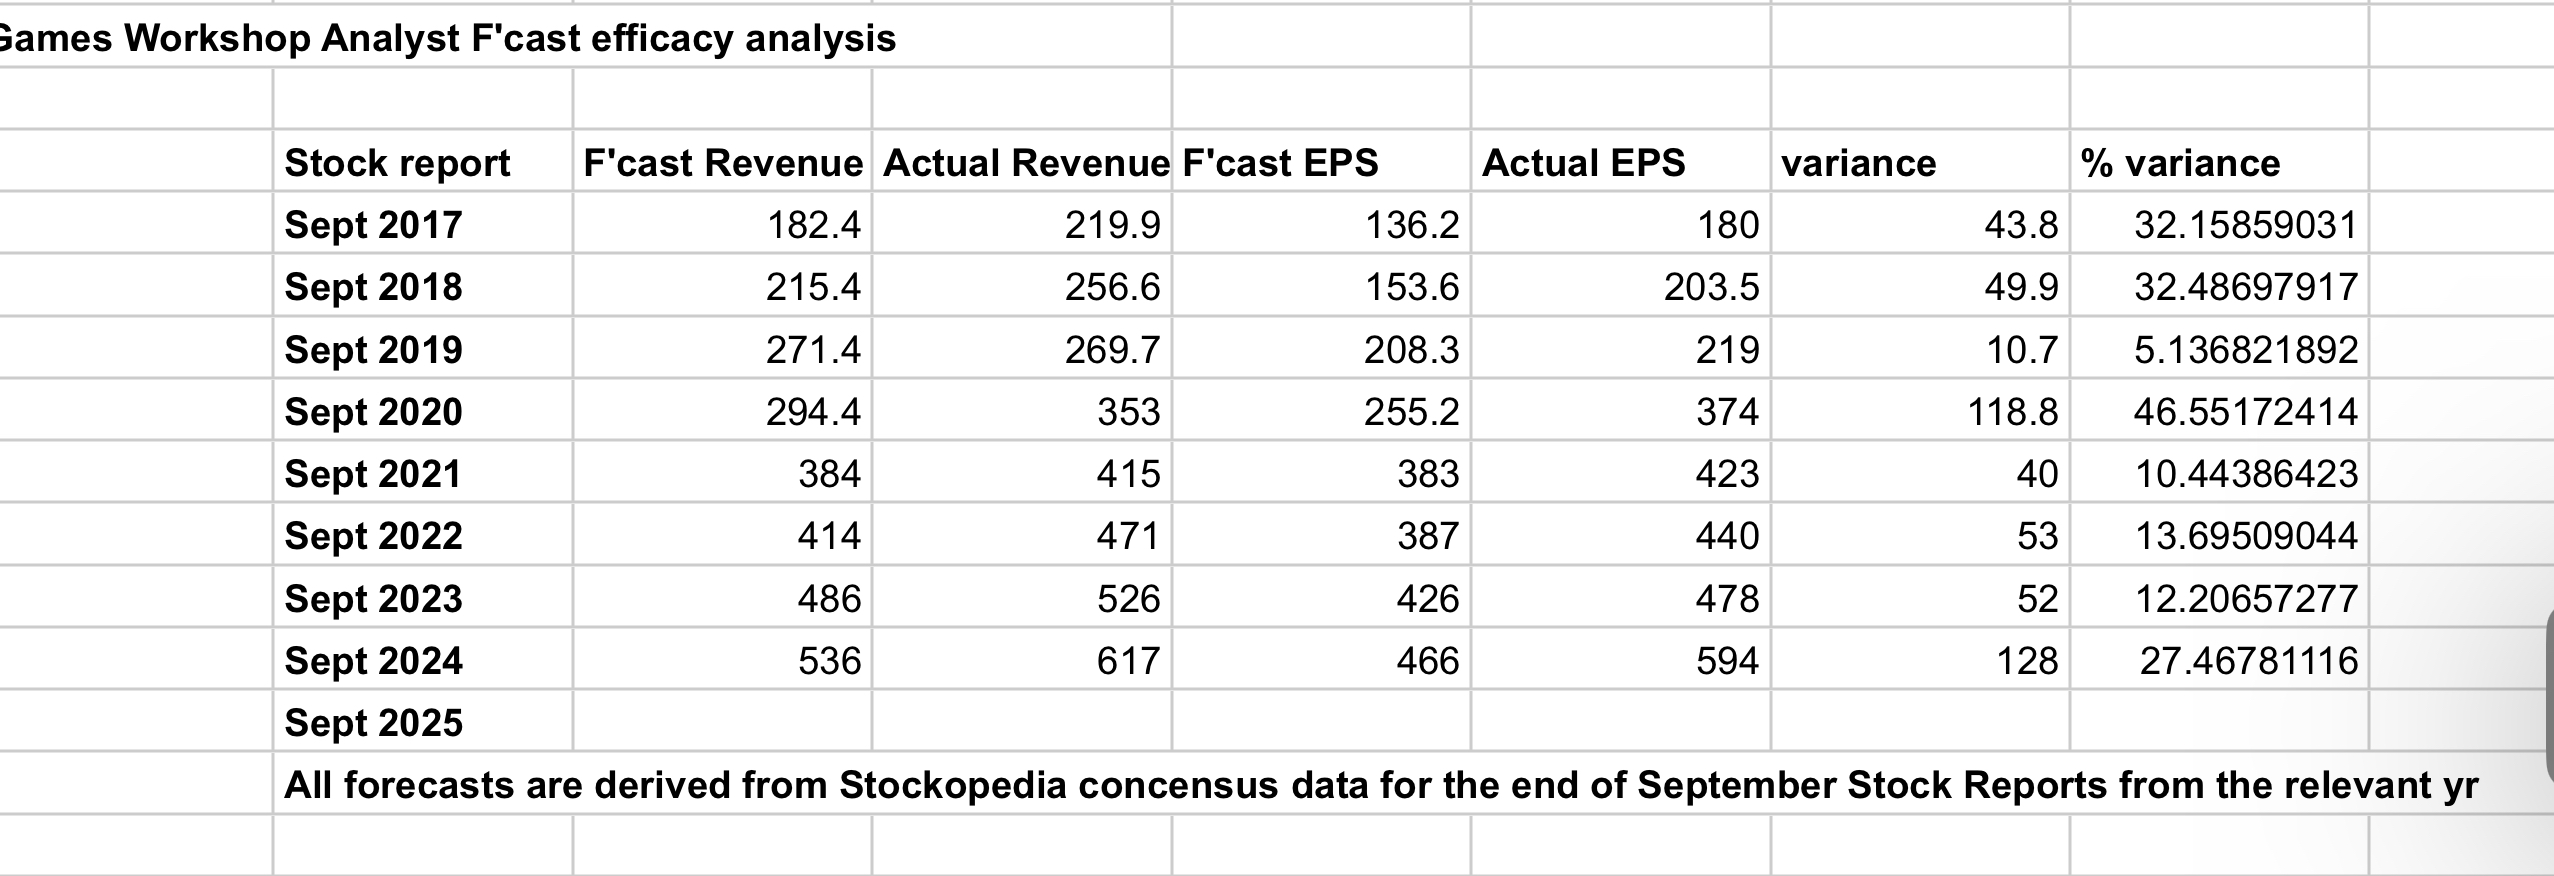
There are two nuances that we should clarify: first, we use broker forecast earnings, not historic earnings; and second, we use the Slater PEG ratio, which incorporates an additional restriction: a company must have 4 consecutive growth periods, including two forecast periods. As such, this rule incorporates an earnings streak aspect.
We create a 'dummy' portfolio using the following process: The screen is rebalanced…