This was a claim I heard earlier in the week in efforts to explain the share fall in the US markets.
That immediately reminded me of the quip from Paul Samuelson , that Wall Street Indexes predicted nine out of the last five recessions.
However various sources seem to regard inversion of the yield curve as a very strong indicator, so I thought I would have a look myself.
Firstly a bit of explanation for those who haven’t looked closely here before.
What is the Bond Yield Curve?
Essentially Government Bonds with different maturity dates will show different yields (on their current market value, rather than the original yield at issue). Under normal circumstances, bonds which will mature later than those maturing sooner. I won’t expand here on why that is the case; there is a lot of information out there if one wishes to look and I don’t want to get sidetracked on why I think some of it is a little too superficial.
So what is flattening or inversion of the yield curve?
Simply, flattening of the yield curve is when the yield on long dated bonds moves closer to that of short dated bonds and inversion is when long dated bonds actually yield more than short dated.
The latter circumstance is indicative of market uncertainty and is said to be highly predictive.
December 2006
This is cited as a good example of the predictive power of yield curve inversion.
At the beginning of December 2006 all was fine with the world, US GDP was up around 5% year on year (albeit down from the 7% level seen a year before) and the S&P 500 stood around 1,400 up around 12% over the year.
But, the yield curve looked like this :
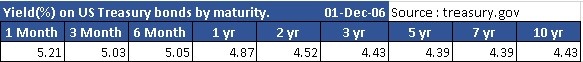
You could get a higher yield on short term bonds than on long term; the yield curve was inverted.
For the next few months all continued as it was, the S&P continued upwards to exceed 1,500 in July 2007 and GDP growth remained fairly stable at around 5% and even the yield curve was largely flat rather than inverted.
I won’t drone on about what happen next, but suffice to say that from around October 2007 , both the S&P and GDP growth headed South and by March 2009 the S&P was…