The End of the Nasdaq Bull Run?
Let me be clear - almost certainly not!
So in two days over Thursday and Friday last week, the Nasdaq 100 (as represented by the QQQ ETF) dropped a grand total of 6.3%. Now this might seem a large move downwards, but it is not really.
We should recall that, prior to this 2-day drop, that the Nasdaq-100 had gained an incredible 78% from the 23 March low. So as I said, a 6% fall is really not that much in this context.
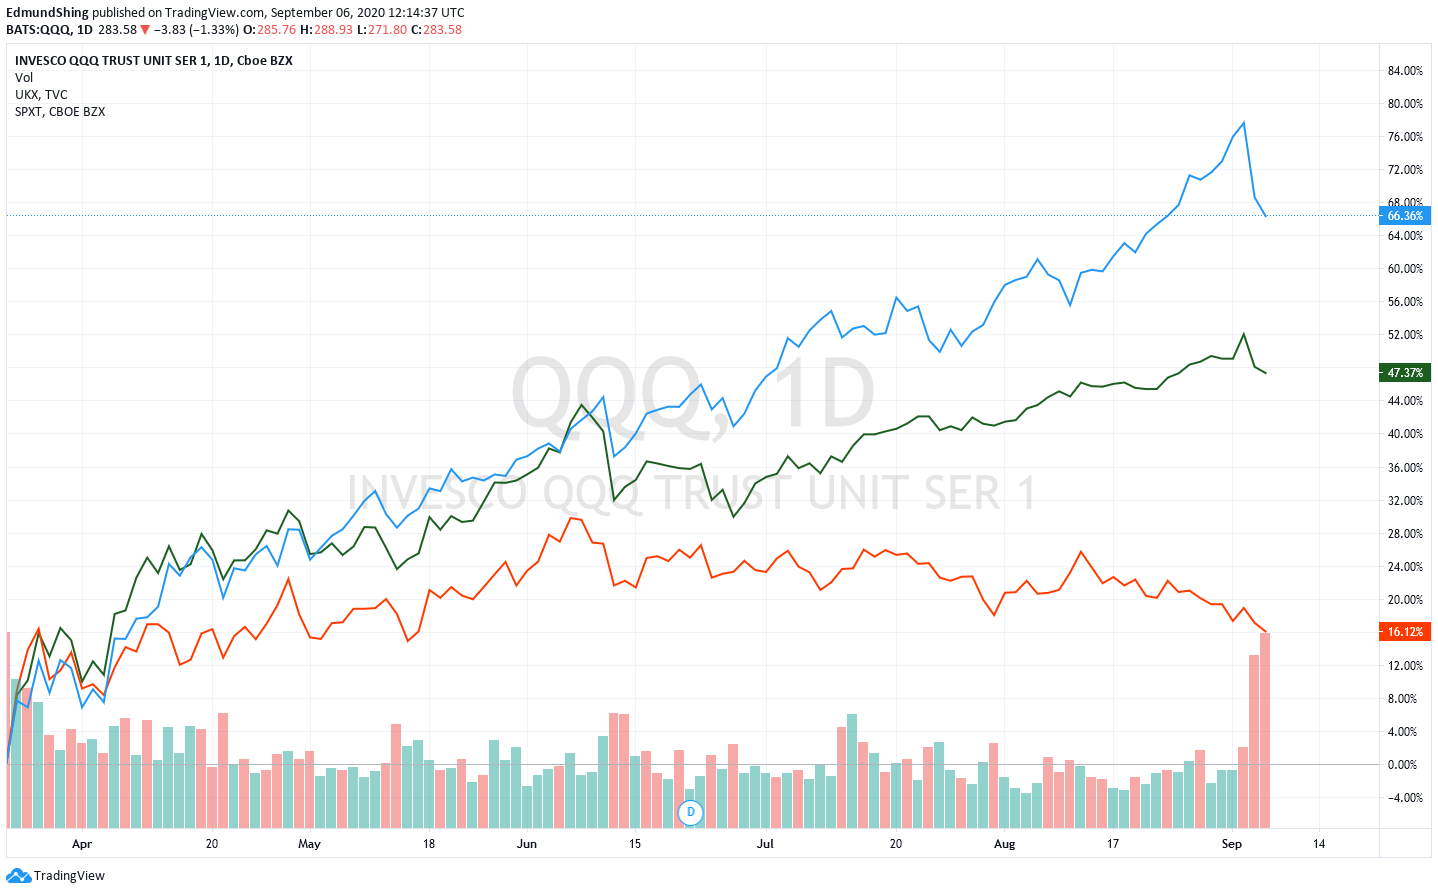
Bear in mind this even after this pull back, the Nasdaq 100 (in blue) has gained 66% since the March market lows, compared with a measly 16% for the FTSE 100 (orange) and 47% for the S&P 500 ex Technology index (green). I think most investors would be ecstatic with a stellar return like that after just over 5 months!
Nasdaq-100 far ahead of S&P and FTSE 100
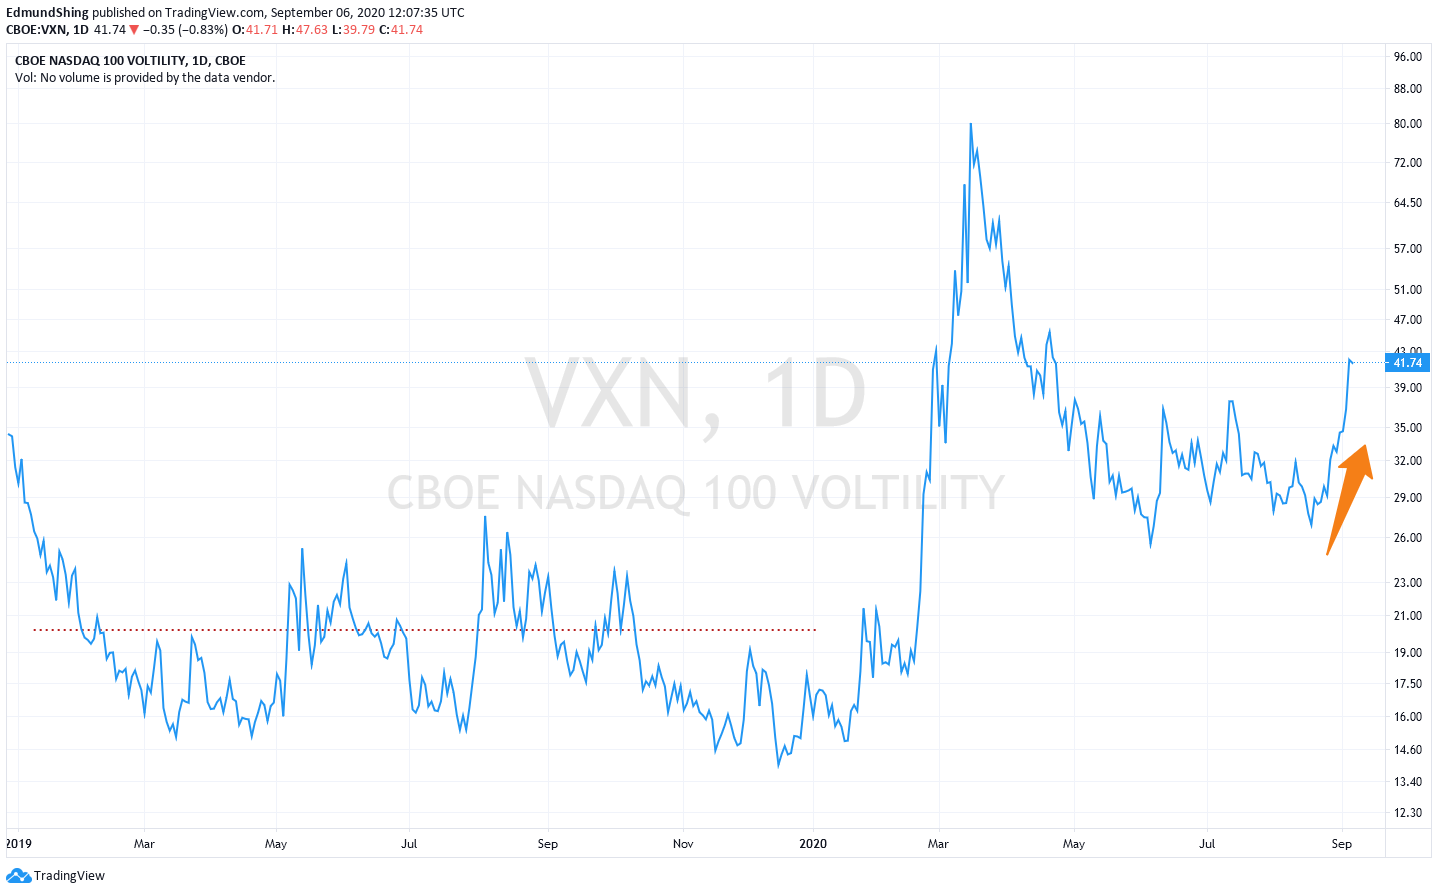
In addition, the Nasdaq implied volatility index, the VXN, had been signalling an expected rise in volatility, as the VXN itself had risen to a high level of 36 (compared with an annual average around 20 for calendar year 2019) even before this latest sell-off.
Nasdaq Volatility VXN has been rising
Lessons from recent(ish) history
For those of you with an investing memory that stretches back at least 20 years, you will no doubt recall another period when the Nasdaq was the standout equity investment globally, namely the late 1990s Tech-Media-Telecom market bubble and bust.
During this period, investors became hugely excited by the prospects for the nascent internet economy, as household internet access and usage of the world wide web really took off with the general public. Yes, it really was only just over 20 years ago!
Many commentators are comparing this current Nasdaq bull market to the late 1990s, which I feel is a little simplistic and actually unfair, even.
Why?
Point 1:
The scale and speed of the Nasdaq’s bull market in the 1990s is actually of a different order to today’s, as can be easily seen from the chart below, where I lined up the performance of the Nasdaq Composite index in the 1990s (ending in the March 2000 market top; in blue)…