Market Musings 13/09/20: Where is the market strength today?

Where is the market strength today?
The leading market in the world, the tech-heavy Nasdaq index, has continued to consolidate lower after its 75% run-up from the late March lows. Technology is a tricky sector to invest in right now, as the momentum stocks like Tesla, Amazon and Microsoft continue to show weakness in the short-term.
I think Technology is probably still a good place to invest for the long-term, if you can find pockets of “value”, however you choose to define that in a high-growth technology stock.
However, this consolidation of technology momentum might take some time still, so it might instead be worth looking elsewhere for pockets of strength in global stock markets. But where are they?
Country indices: Germany, Sweden lead the way in Europe
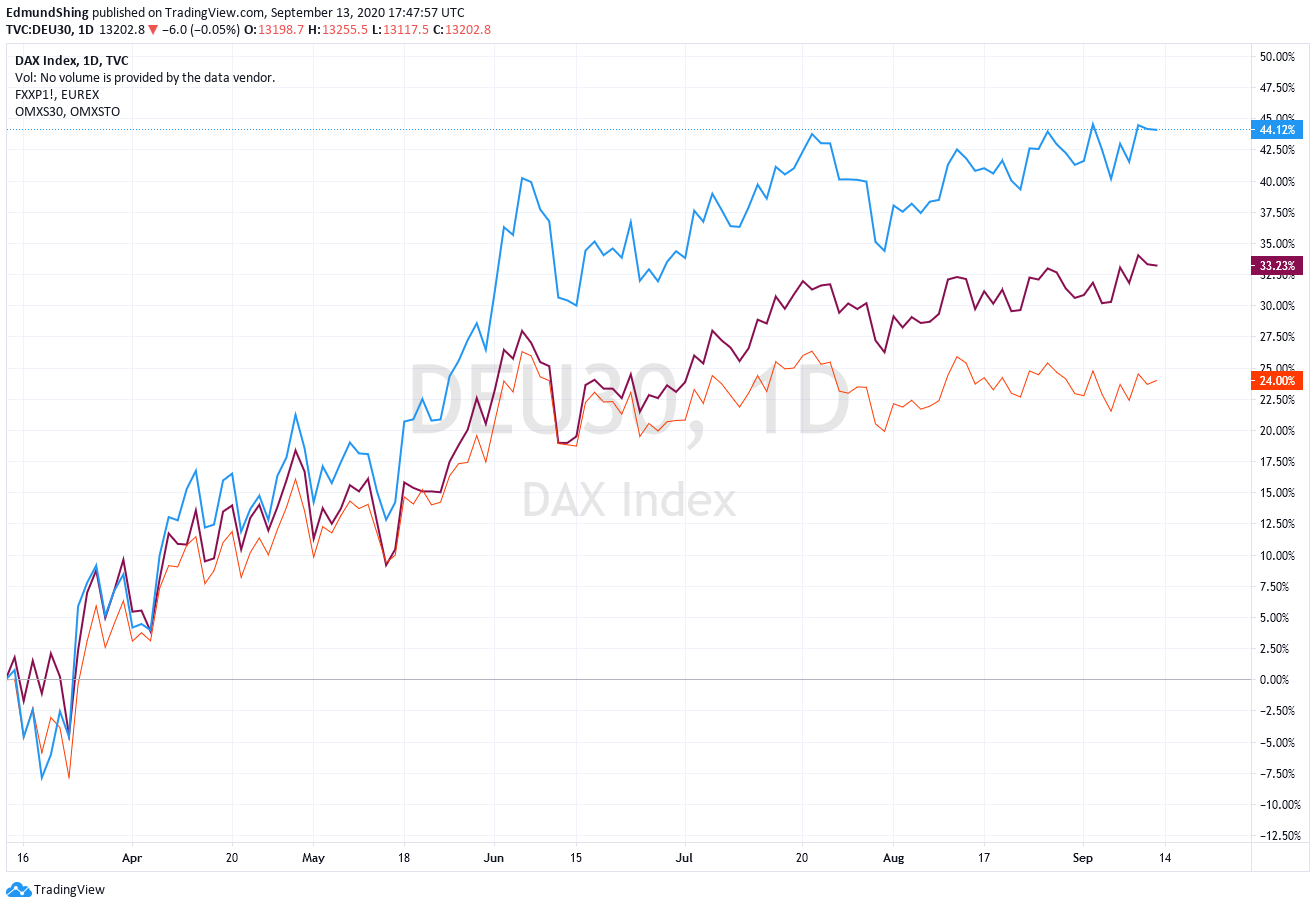
At a country level, the strongest stock markets from a momentum standpoint remain the German DAX index (in blue) and the Swedish OMX index (in purple). Both continue to mark a strong recovery from the March lows, powered ahead by the strong industrial cyclical sector exposure.
DAX and OMX 30 indices are clearly outperforming the rest of Europe
In the UK, one can buy exposure to the DAX index via the XDAX ETF (in GBP), an Xtrackers ETF that carries a very low annual expense ratio of just 0.09%.
Sector indices: Autos, Industrial Goods, Chemicals
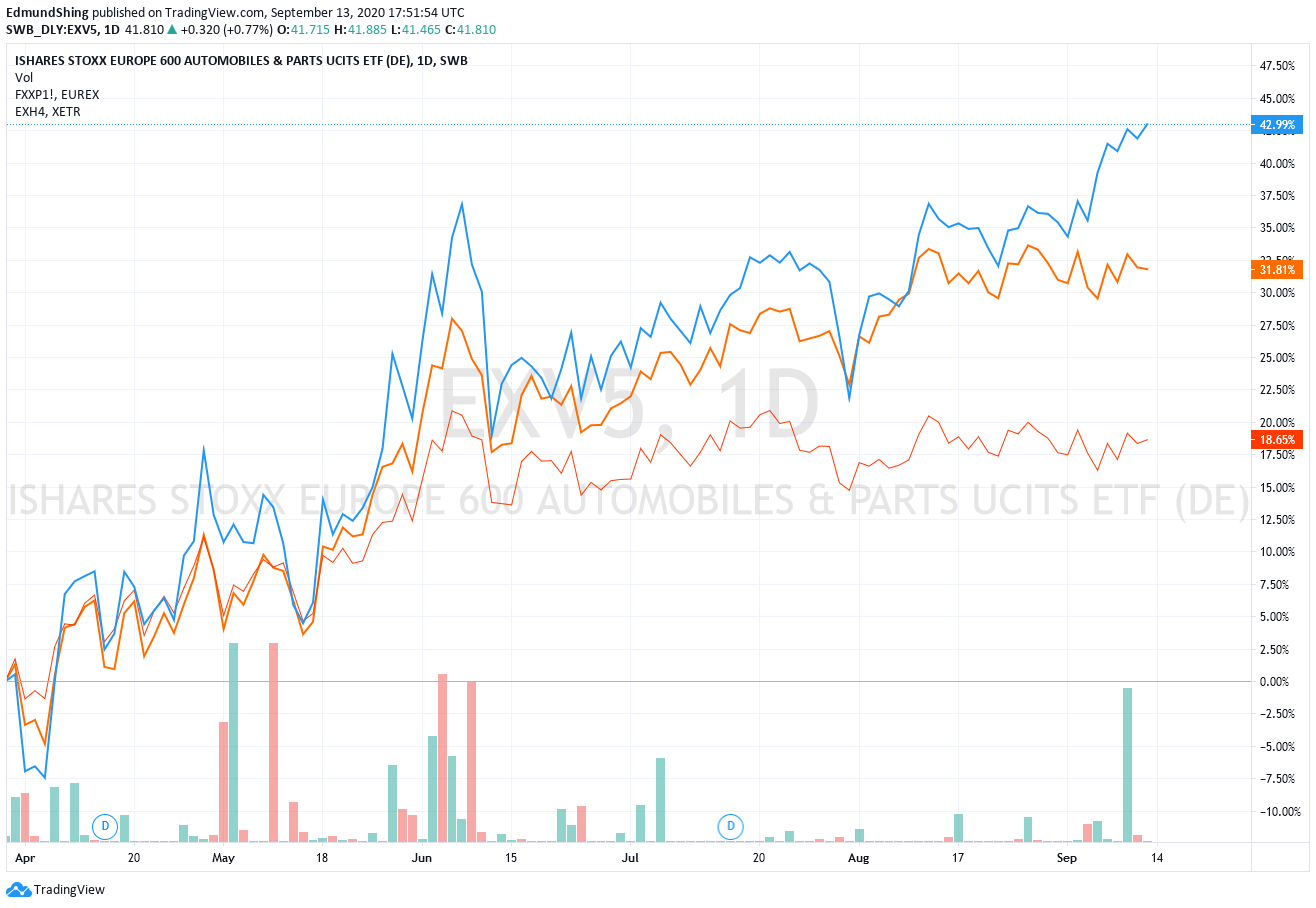
As I said, these two stock markets are dominated by industrial cyclical sectors, including Autos and Capital Goods. Unsurprisingly then, these two European sectors (Autos in blue, Industrial Goods & Services in orange) have outstripped the STOXX Europe benchmark index substantially since March.
Autos and Industrial Goods & Services sectors lead in Europe
At a stock level, the Autos company with the strongest price momentum is Daimler in Germany, while the strongest momentum in Industrial Goods & Services can be found currently in PostNL in the Netherlands and Deutsche Post in logistics, and Luceco (LON:LUCE) in the UK in LED lighting.
iShares offer sector ETFs that replicate the main STOXX Europe Autos sector (EXV5) and the STOXX Industrial Goods & Services sector (EXH4), both quoted in euros and listed in Germany.
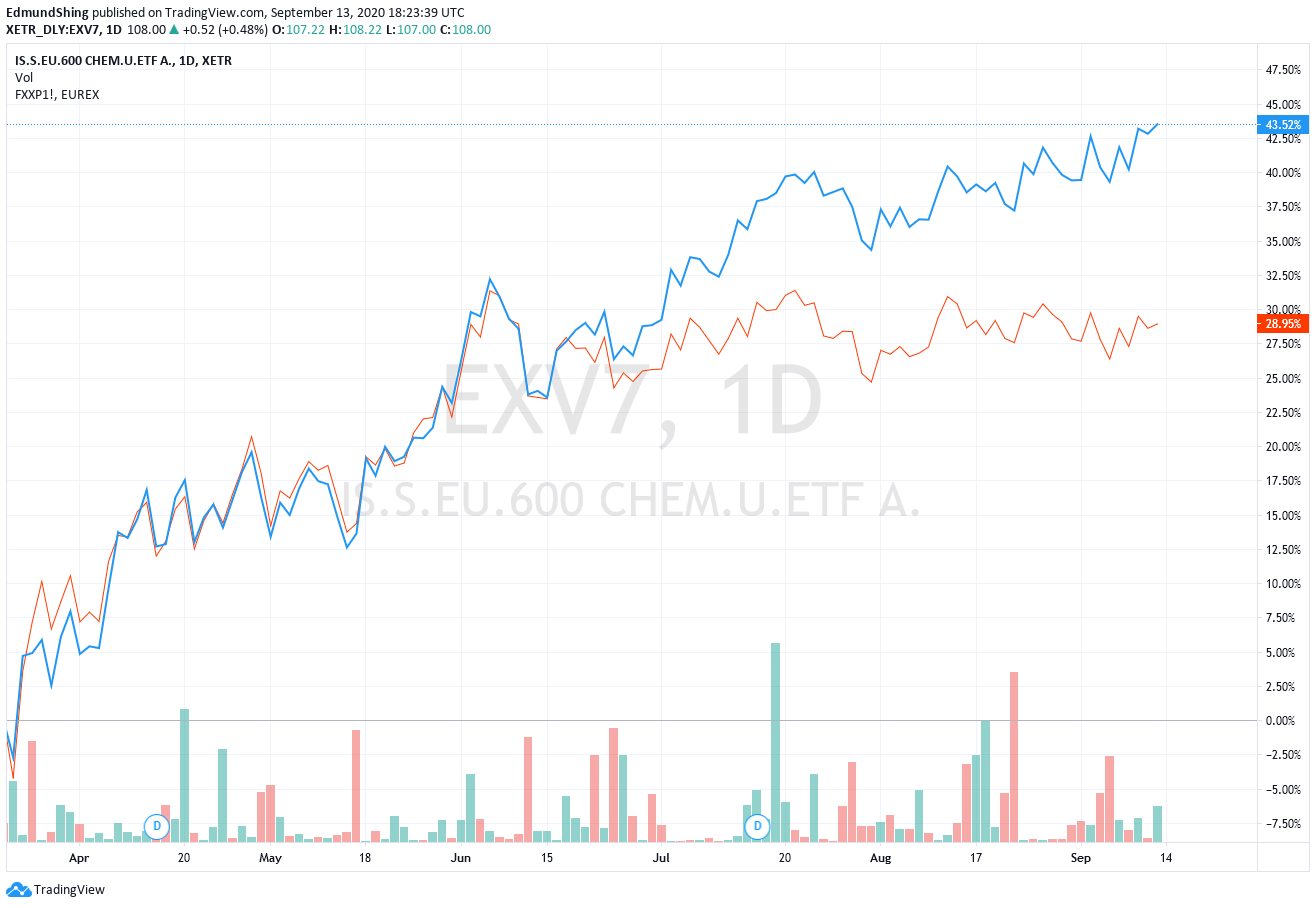
But in actual fact, the European sector with the strongest momentum at present is neither of these, but the Chemicals sector (in blue) - led by high quality subsectors with global oligopolies in the form of Industrial Gases (think Linde, Air Liquide) and Flavours and Fragrances (think Givaudan, Symrise and Treatt in the UK). This sector today combines exposure to the global economic recovery together with high profit margins due to their effective oligopolies, supplying the global electronics, industrial and health care sectors in the case of gases, and the global luxury goods (perfumes) and food & beverages sectors in the case of flavours and fragrances.
European Chemicals are in a sweet spot
Commodities: Look to Palladium, Copper
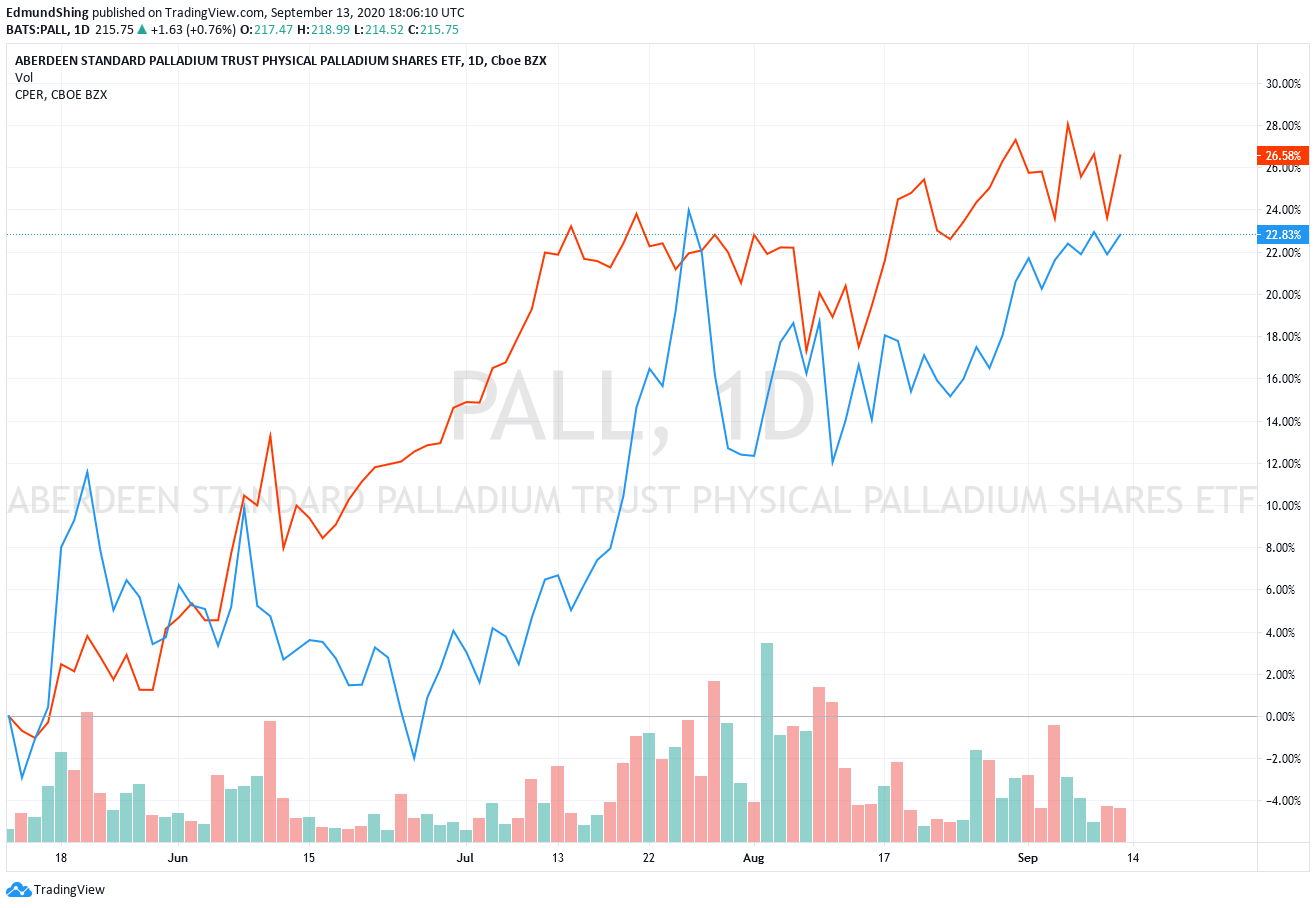
I have professed my long-term bullish views on precious metals, most notably gold and silver, in part weeks. However, for now these “hard” currencies are consolidating around the $1940/oz and $27/oz levels respectively at present. But commodities as an asset class are showing signs of life apart from these two precious metals, most clearly in copper and palladium.
In the case of palladium, this is interestingly linked to the pickup in car sales, as one of the principle industrial uses for palladium is in car catalytic converters. In the case of copper, this perhaps reflects the economic recovery in China, which is responsible for fully 50% of the marginal demand for this economically-sensitive base metal.
Copper and Palladium lead the way in the commodities complex
Wisdomtree offer ETFs to invest in physical palladium PHPD and in copper, COPA . Note that both are denominated in US dollars.
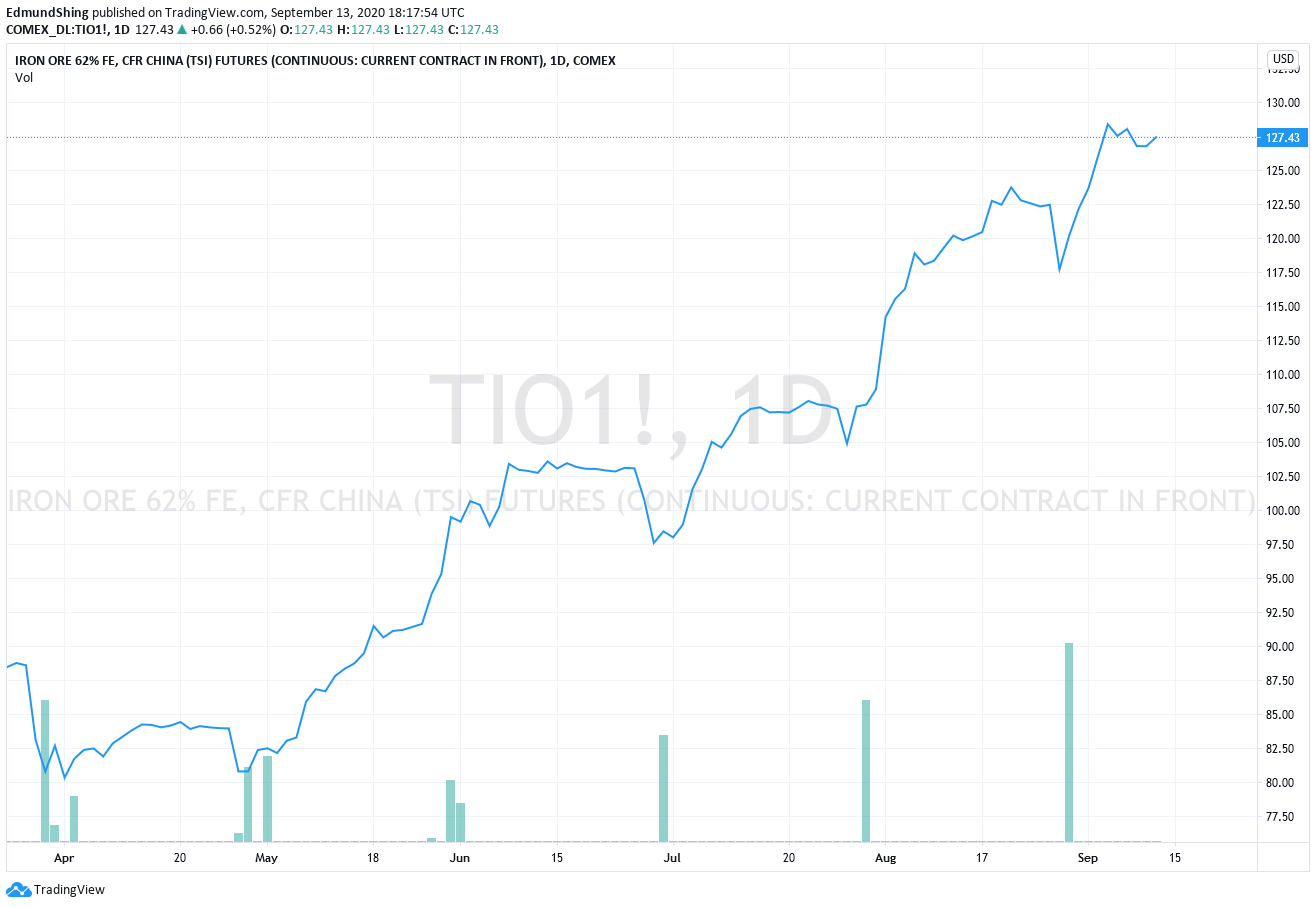
Otherwise, UK-listed companies with exposure to palladium include Sylvania Platinum (LON:SLP) , and Antofagasta (LON:ANTO) Kaz Minerals (LON:KAZ) and Central Asia Metals (LON:CAML) for copper exposure. Even Rio Tinto (LON:RIO) contains substantial exposure to copper, although Rio Tinto remains a global diversified miner with substantial exposure also to other base metals with strong upwards momentum such as iron ore.
Disclosure: I own shares in Sylvania Platinum
Chinese iron ore futures have rebounded strongly since March
Gold & Silver breakouts
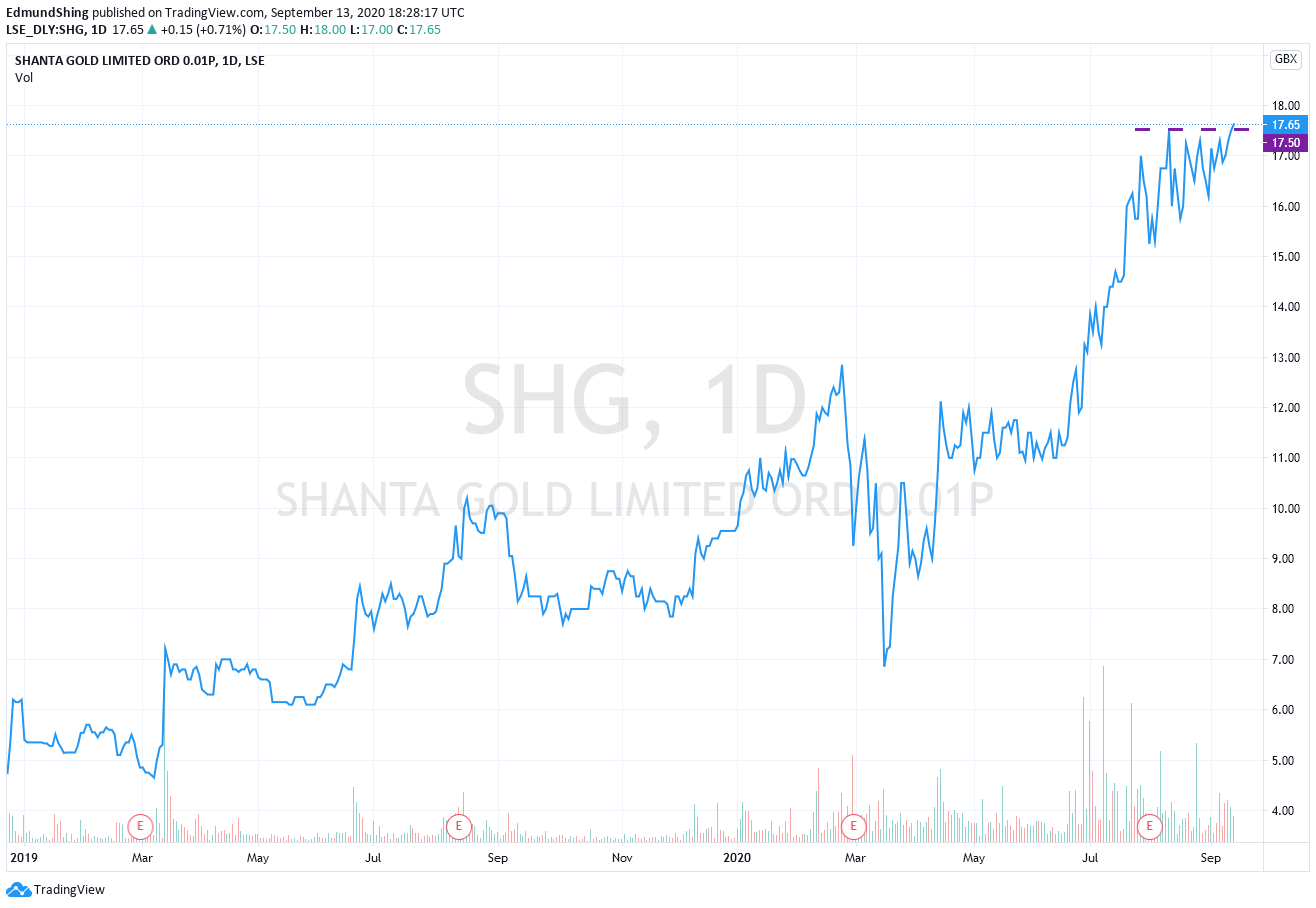
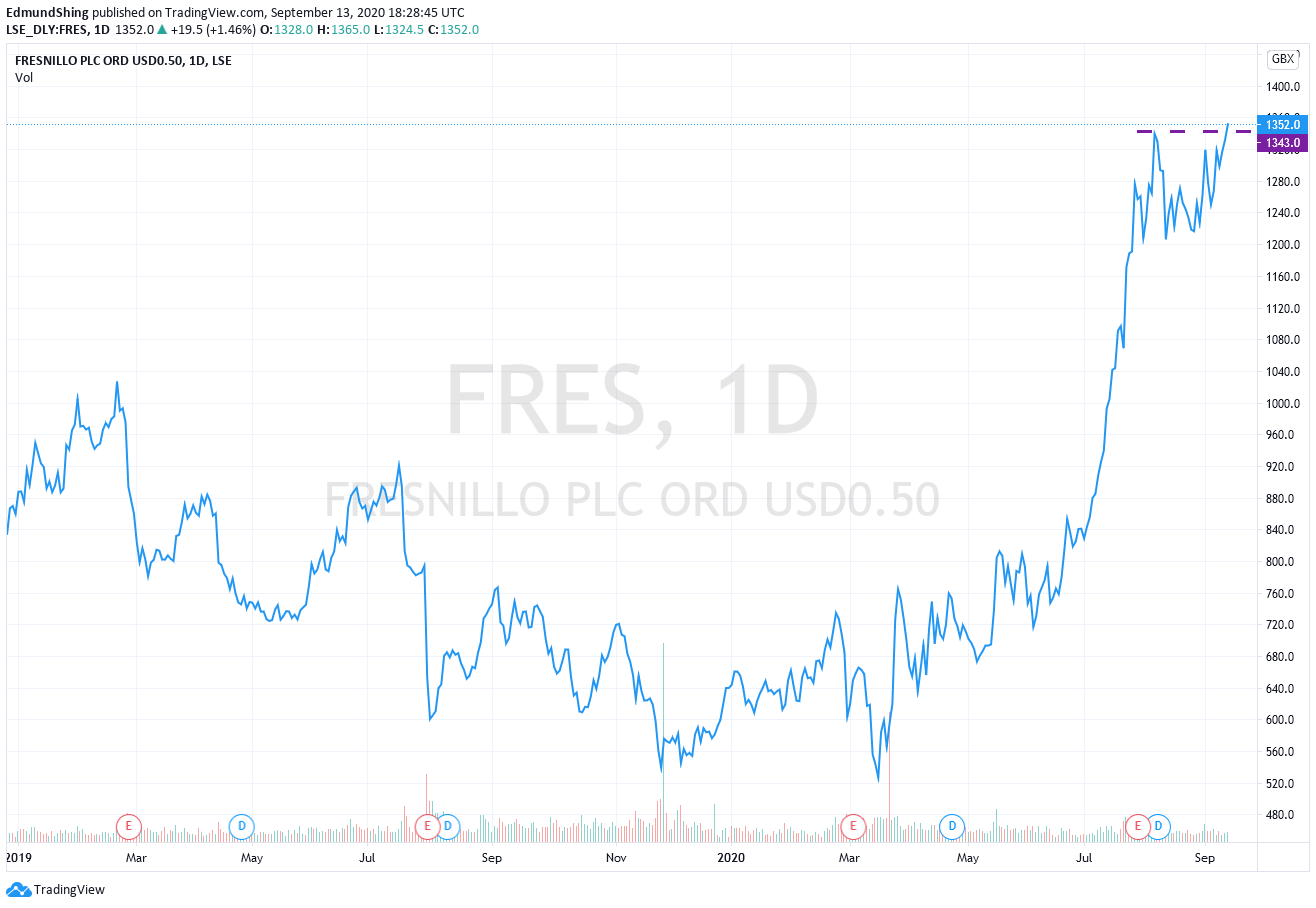
Even while the gold and silver prices remain in a holding pattern for the moment, there are gold and silver stocks that have broken out to new multi-year highs in spite of the lack of leadership from the metals themselves.
They are no doubt being boosted by the Brexit-related depreciation of the pound sterling against major currencies including crucially the US dollar, since these precious metals miners tend to report in US dollars and are of course based pretty much 100% overseas.
Two such stocks that have popped up on my momentum radar screen are the African gold miner Shanta Gold (LON:SHG) and the Latin American gold and silver miner Fresnillo (LON:FRES) .
Shanta Gold and Fresnillo forging new price highs last week
Dislosure: I own shares in Shanta Gold and Fresnillo
Remember, please Do Your Own Research, as I do not give stock recommendations, but merely suggestions for further investigation!
Have a great week ahead,
Edmund
Disclaimer
This is not financial advice. Our content is intended to be used and must be used for information and education purposes only. Please read our disclaimer and terms and conditions to understand our obligations.
8 comments
https://www.mining.com/markets/commodity/rhodium/
infomine also gives rhodium price
Thanks Edmund. It certainly seems that metals, both precious and base, are doing well and likely to increase in price if one factors in a cheapening of world currencies, particularly the USD and also the likely surge in China's economic recovery. I hold Sylvania Platinum (LON:SLP) and was recently challenged to sell when the price dipped to below the 200 day EMA in late June/early July. There was no bad news accompanying this price dip so I decided to hold on. In retrospect this was probably a tree shake. Over the last 10 weeks the price has nearly doubled. This stock has been subject to a couple of other apparent tree shakes over the last 18 months. The next price dip might well turn out to be a good buying opportunity.
Anthony 127 - Rhodium Prices can be obtained from a number of sources including :
www.https://www.kitco.com/market/ and www.http://www.platinum.matthey.com/prices/price-tables
Numbers on Rhodium will not be the same, the Ask price on Kitco is usually the nearest price to those quoted on the mattey website.
Robin
Thank you; that's very helpful.
Looks like the leaky tailings has had a big impact on Central Asia Metals (LON:CAML) today. Seems like an over reaction but perhaps there is more to it than their statement. Potentially a fine for river pollution. Any further comments welcome. I just bought this share today @ 180p so hurting at the 20% reduction. I hope that the results will be kind on Wednesday and share price responds.
I am not a Technician or Chartist by nature but as a holder of Sylvania Platinum I am encouraged by the 10 day average volume exceeding the 3 months average volume by 55% This suggests (I think) that the share is under accumulation given that the share price has increased significantly in the last few weeks.
I also note that Sylvania Platinum (LON:SLP) has reappeared on the Slater screen as a result of upgrades in recent EPS forecasts. I have produced my own stricter version of the Slater screen which requires that ROCE is above 18%, that Gearing is below 50% and that Operational Cash Flow per share exceeds EPS.. It is significant I think that Sylvania is the only UK share that currently qualifies for this screen.
The graph above on the Rhodium price is very helpful. As a regular viewer of CNBC I am able to check on Platinum and Palladium prices regularly but I would be grateful if anyone can advise me where to check on Rhodium prices?
The following may also be supportive of your view on Palladium / Sylvania Platinum! Sylvania is planning to pay a Metals based Dividend in its Q3 (Jan/Mar 2021). Please note that short-term care is needed as the SP over the last 3 years has been weak between now and mid October. Rhodium is actually far more important than Palladium from a P+L and Cash Flow perspective and we can expect a record Sylvania Platinum Q1 2020/2021 (to Sept 30, 2020) when results are out between Oct20 and 31st, based on current metal prices.
RHODIUM AVERAGE MONTHLY PRICES BETWEEN AUGUST AND DECEMBER SINCE 2016
One positive with the proposed "Metals Dividend" maybe history - in each month between August to December in 2016 to 2019 inclusive, the Average Monthly Price of Rhodium has risen Month on Month.
2016 Aug 597, Sep 627, Oct 657, Nov 712 and Dec 715.
2017 Aug 954, Sep 1,048, Oct 1,273, Nov 1,308, Dec 1,470.
2018 Aug 2,214 Sep 2,308, Oct 2,312 Nov 2,337, Dec 2,353.
2019 Aug 3,697 Sep 4,564, Oct 4,906 Nov 5,271 Dec 5,568.
2020 Aug 8,847 Sep???
Source: Kitco.com (Stats).
PALLADIUM - 2017 to 2019 Same Trend (but NOT 2016)
2017 Aug 912, Sep 936, Oct 961, Nov 1,000, Dec 1019
2018 Aug 918, Sep 1,010 Oct 1,084 Nov 1,141 Dec 1,247
2019 Aug 1,453 Sep 1,601 Oct 1,601 Nov 1,768 Dec 1,904
Source WWW.Kitco.com
If this trend continues in 2020, the results for the Metal Price Windfall Dividend should be v. positive, as the company's calculation is using long -term broker consensus prices for these metals for the calendar year 2020 not just the last 5 months.
Excellent point Robin,
Absolutely true in the case of Sylvania Platinum (LON:SLP) .
While recent results may have disappointed lofty expectations, Sylvania does indeed remain very exposed to the bull market in Rhodium, which we can see below has outstripped even palladium of late. And of course, while a risky investment due to its reliance on other companies to provide the raw material it then reprocesses to extract the platinum group metals, it is also exceedingly cheap and should see a continued explosion in free cash flow.