Welcome to our Momentum Monday newsletter.
Remember: In Stockopedia momentum doesn’t just mean price moves (though it is a big part of it.)
Just to refresh your memory Stockopedia’s Momentum Rank is a ranking system based on a blend of price momentum and earnings momentum in the form of upgrades, positive revisions to earnings and earnings surprises to learn more, read here.
In this report we pay no attention to the factors of Quality and/or Value. However, when combined with either of these two factors, an analysis of the charts can be a powerful strategy, if applied with discipline.
Week ended 2 Dec 2022
Markets have experienced strong rallies across the week on hopes that the pace of inflation, and therefore rate rises, are slowing and that China may be close to solving its Zero COVID policy issues.
I start by looking at weekly market charts (Both the S&P500* and the S&P/ASX200 in order to determine whether we can be aggressive in our stock positioning or whether we should be more cautious. Once established if our market is in an up or downtrend, only then do I start to look at individual charts and act accordingly.
* The reason for looking at the US S&P500 chart is because it plays such a large role in the sentiment of the broader Bourse and therefore it can’t be excluded from broader consideration.
S&P500 (US)
The S&P500 achieved its second consecutive week of positive gains.
This recent run has taken the index to the top of the well-entrenched downward channel. A channel which had been forming since December 21.
In the short term we are at a pivotal juncture in the US market. Either the index will hold and rise above 4280.1 which will be bullish and see the next level likely to be tested around the 4620 mark.
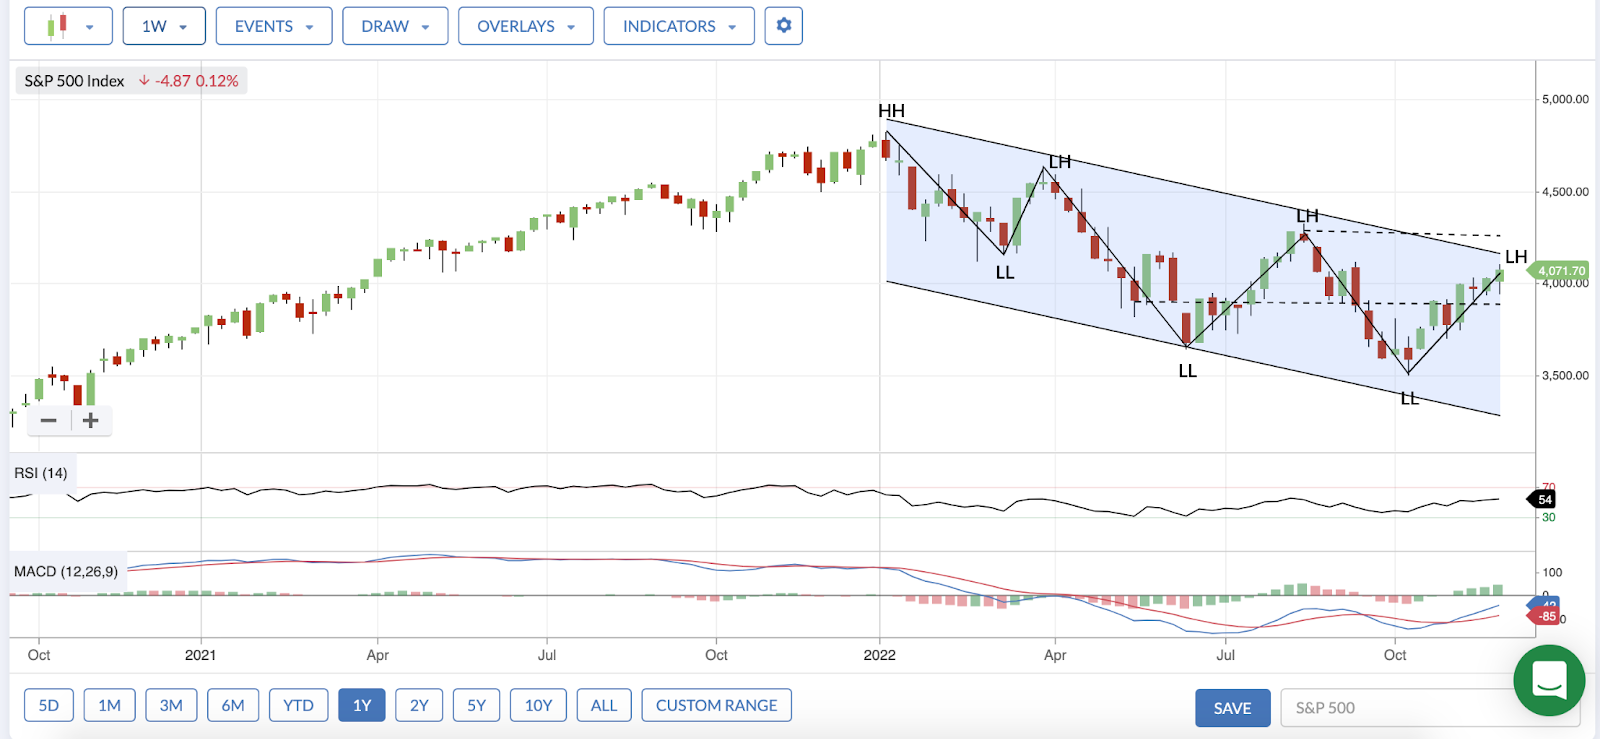
S&P 500 Weekly Chart
Or, if it fails to hold 3903, there is a real risk we could head back to sub 3400 which is the bottom end of the channel. The level is relatively significant for short term investors given the past three weeks have seen the wick of each weekly candle come close to testing.

S&P500 14 Nov – 28 Nov
Pleasingly, the index has been able to consolidate…