We are back for another week. With markets constantly on the move, Momentum Monday a great way to start your week.
Markets last week continued to balance concerns over debt ceilings, high interest rates and a potential recession as they do. Let’s look at how they stack up for the week ahead.
We are proceeding with the amended Momentum Monday as per the structure of the last two weeks. If you want to read more about it, revisit the edition from two weeks ago here.
The format for this week's edition is:
Broader market sentiment
Member requests
Stocks in the “Shine Zone”
52 week high screen (including changes)
A reminder that you don’t have to read all of it. Simply scroll to the area of interest.
If you have any suggestions for us, please be sure to include them in the comments below.
Broader Market Sentiment
We look at the direction of both the US and ASX markets to gain an understanding of the broader sentiment at the minute. While this analysis is not to time specific entry into or exit out of stocks, they are useful in helping us determine how aggressive/cautious traders should be in their trading.
US S&P500
Debt ceiling discussions aside the S&P500 eeked out a small gain of 0.3%. Much of the caught in tech stocks where the gain on the NASDAQ this week was 2.5%
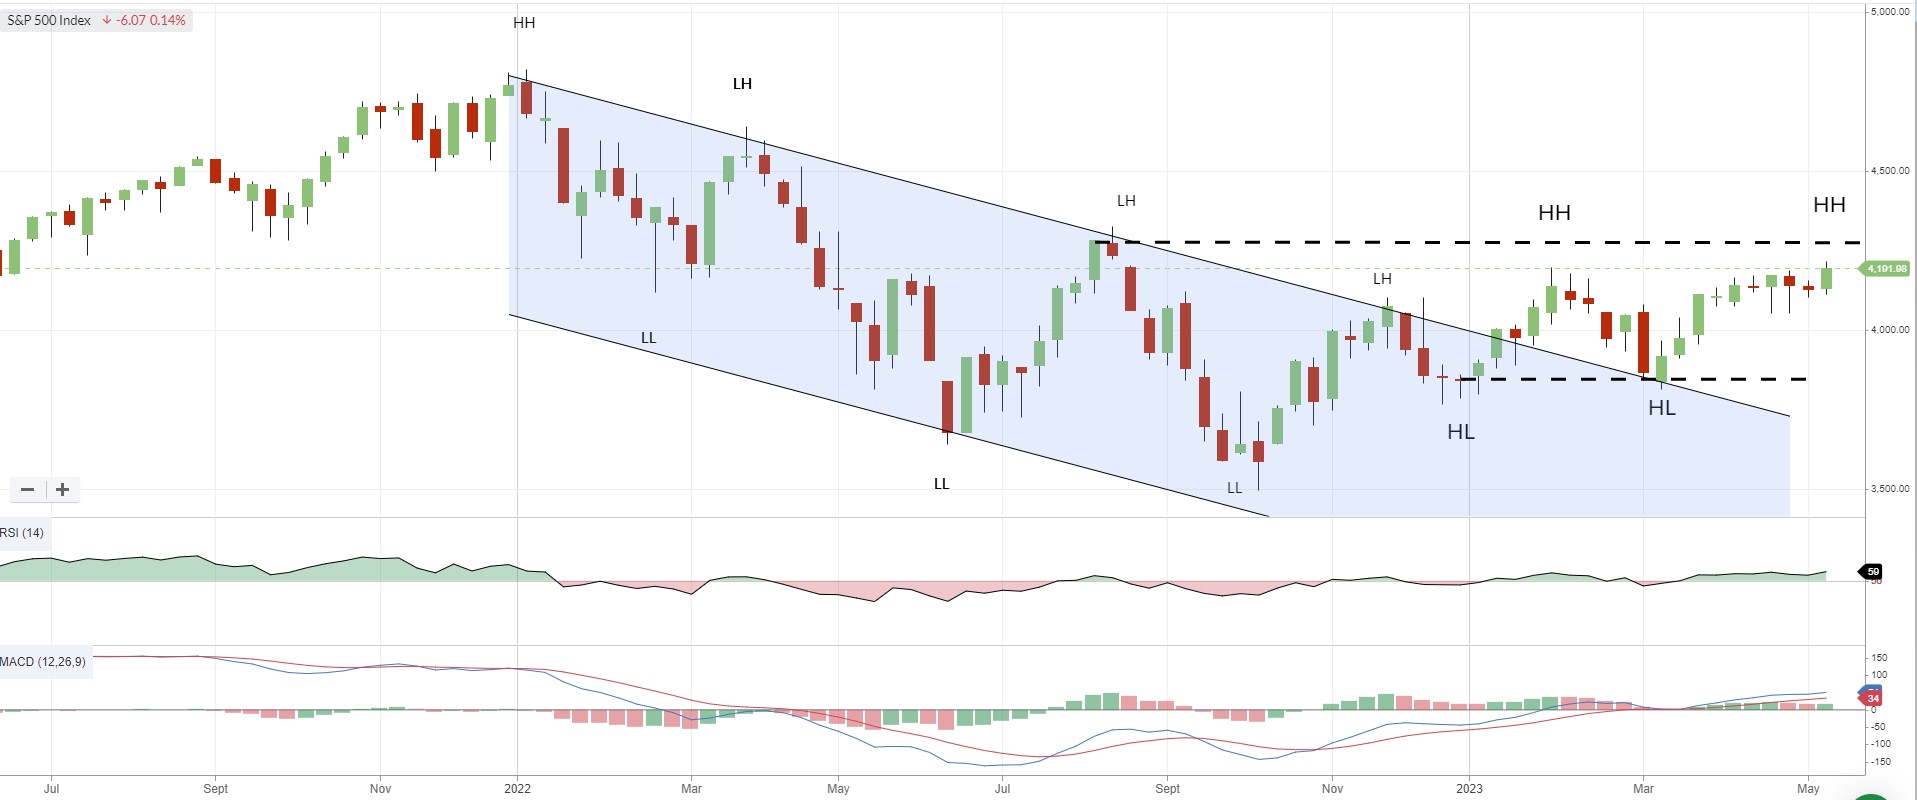
S&P500 Weekly chart
We spoke last week of the positive move lifting the index out of its multi-month sideways pattern and fortunately it maintained key levels this week.
Just as a refresh, short-term targets for traders is an upside target of 4280, with support at 4056 for immediate comfort (this is the April low and likely where price could converge with the up trend line., but at least remain above 3840.
The daily chart of the index supports the more positive view with 2023 thus far being a positive year. We started the week with a few down days, but behaviour towards the end of the week took us above last Friday’s close
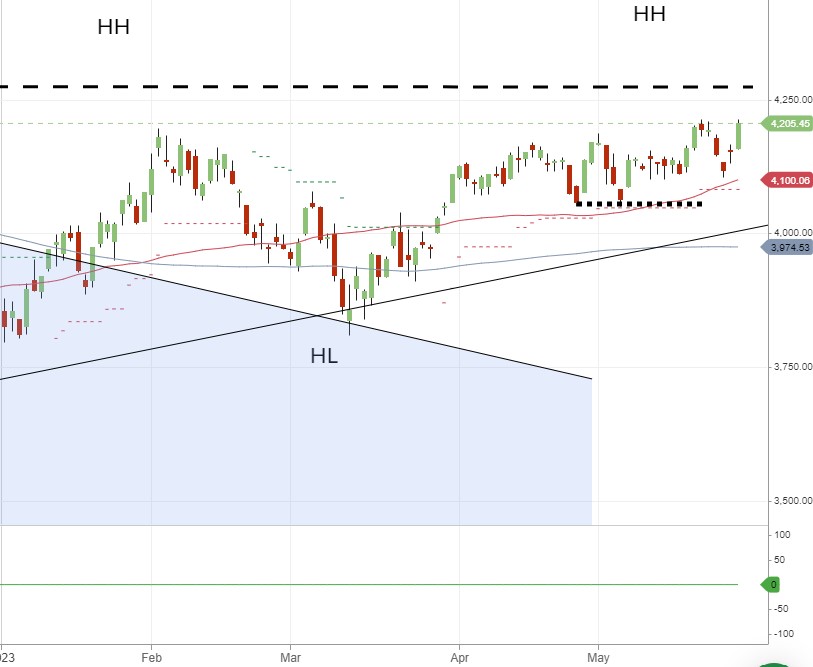
S&P500 Daily chart since start 2023.
Should we get to our upside target…