Our thoughts go out to our clients and friends in Auckland. We hope you have been spared the worst of the damage caused by flooding and that you'll get back on your feet quickly.
—----
"Positive"
That is how the movements of the market were last week. And as we lead into February there is renewed optimism that we may in act miss global economic armageddon. Even Treasurer Chalmers this week painted a more positive picture for the times with his vision for a more "values based capitalism ". Better than expected US data was also a theme this week as was the continued reopening of China.
Pleasingly our charts are starting to reflect that renewed optimism.
Week ended 27 January 2023
S&P500
US markets had an incredibly interesting week. According to the number each of the Dow, NASDAQ and SP500 rose. In the case of the latter it lifted 2.4%.
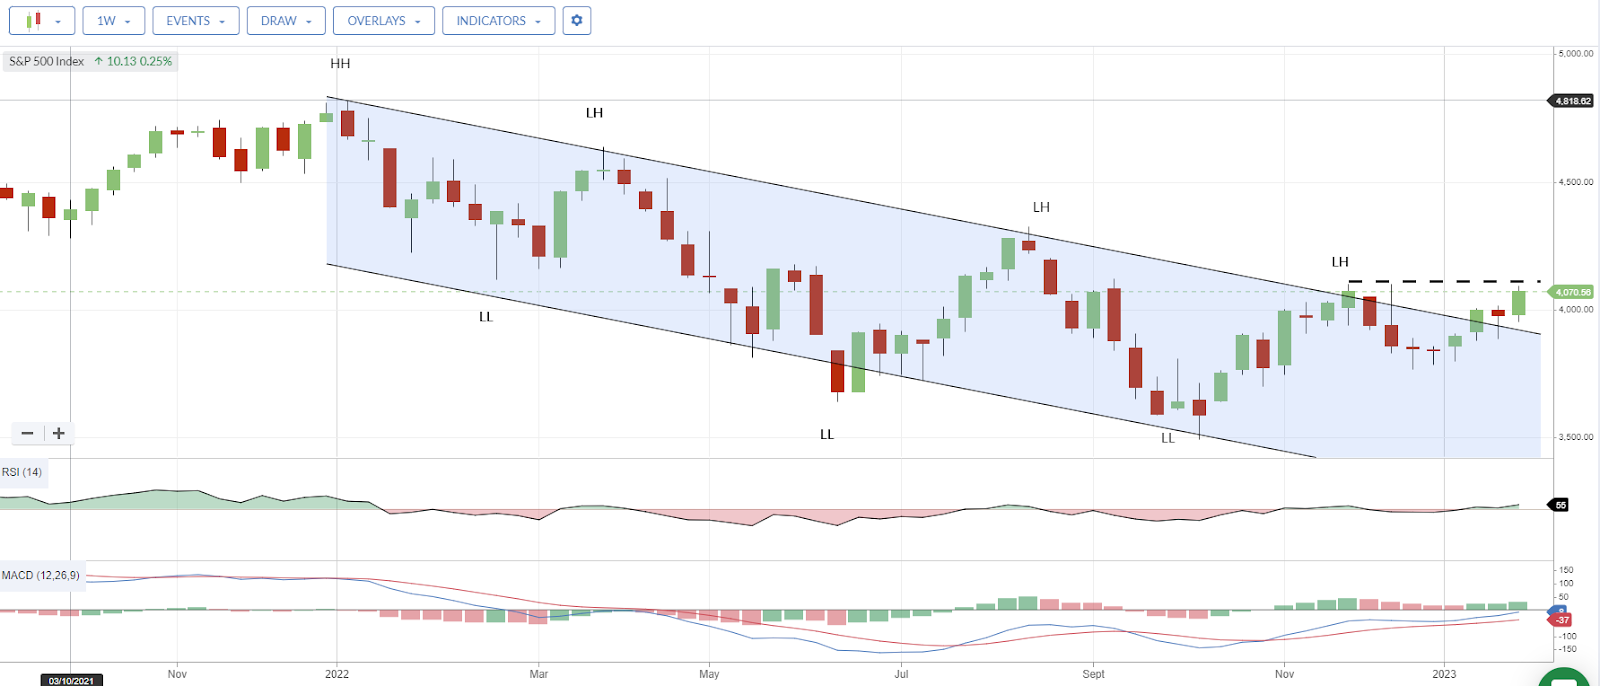
SP500 Weekly chart
Other than the positive week there were a number of key features about this week that were particularly interesting.
The price action takes us to the previous lower high. Should next week see a move above the level of 4100, then the lows of December become the new higher lows and dare I say it, we are in a new short term uptrend and we prime ourselves for a run at 4280 which would be quite a bullish signal indeed.

Further we sustained a move outside the downward channel which has been establishing since early last year. While not significant in of itself, it does show the pace of the decline over the last year may be easing. When combined with the positive price moves as described above we see the source of current renewed optimism.
For those that like to monitor the positions of the 50/200 day moving averages, the two lines have been converging and are now at their closest integer since April 2022.

Should a golden cross emerge (50 day moving average crosses back above the 200 day moving average) that will provide some further comfort the pace of the sell off may be ending.
Both the Weekly RSI and…