There was an article here a couple of weeks ago about simulating share prices using a Random Walk generator in Excel. This set me thinking about simulating feedback from the traders - working on the assumption that stock price movements are random, but steered by simple psychological quirks. I did try years ago to write a prediction algorithm using Regression - guess what, to no avail. And TL:DR, there's no payoff to this article either.
The reason I'm writing it up is this - I noticed that among all the Technical Analysis tools available, one that's missing is the ability to draw Support and Resistance lines automatically. I may have missed such a tool deliberately in my eagerness to work out how to generate these myself.. anyhow.
I'm using the language R, for which folk everywhere are writing packages of code for all kinds of applications - there are a few on the topic of share-trading: quantmod, TTR. TTR stands for Technical Trading Rules, and its purpose is, I suppose, to write compound rules that parse a history of prices & volumes for some over-complicated bespoke signal. But there's no Support/Resistance Level function in it. Most of the functions available are variations of things like Bollinger bands, things which use moving averages and standard deviations. This seems to be a gap - it's a commonplace to talk about "breaking through the resistance", "reluctance to fall below the support", and so on. Seeing these levels is subjective, but of course that doesn't mean we can't winkle them out mathematically.
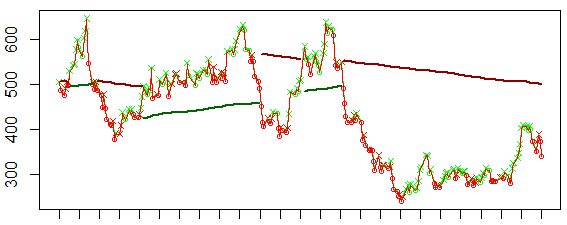
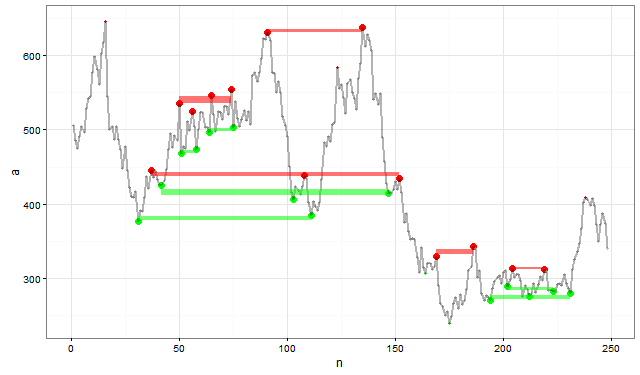
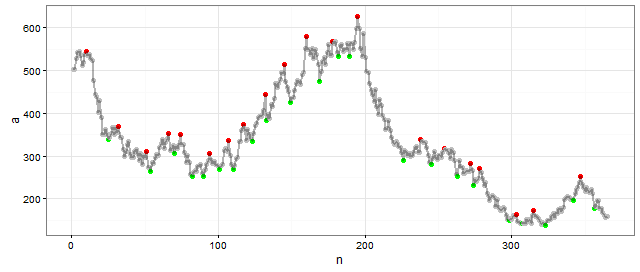
Here goes. First, generate a random-walk sequence, and mark local peaks and bottoms. (not sure if these pics are too wide..)
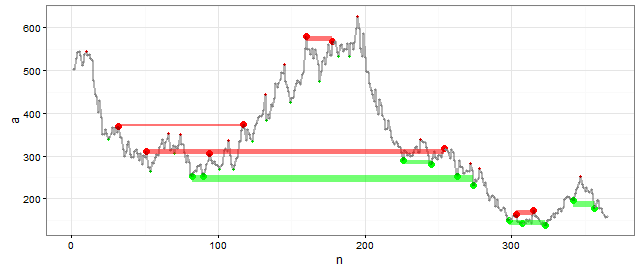
Then take those extremes and run a clustering algorithm on them - I used one called kmeans. Maybe others would be better, idk. I won't describe all the fiddles involved here to identify what to keep, it was pretty traumatic. Here's the result..
So now I can extend the sequence, taking these levels into account, and updating the resistance/support levels from the recent past, each time. All I did was to make the wandering line baulk at crossing a resistance line upwards, or a support line downwards. The line-generation program only looks at the sequence's recent history, so old levels drop out after a…