Hello All,
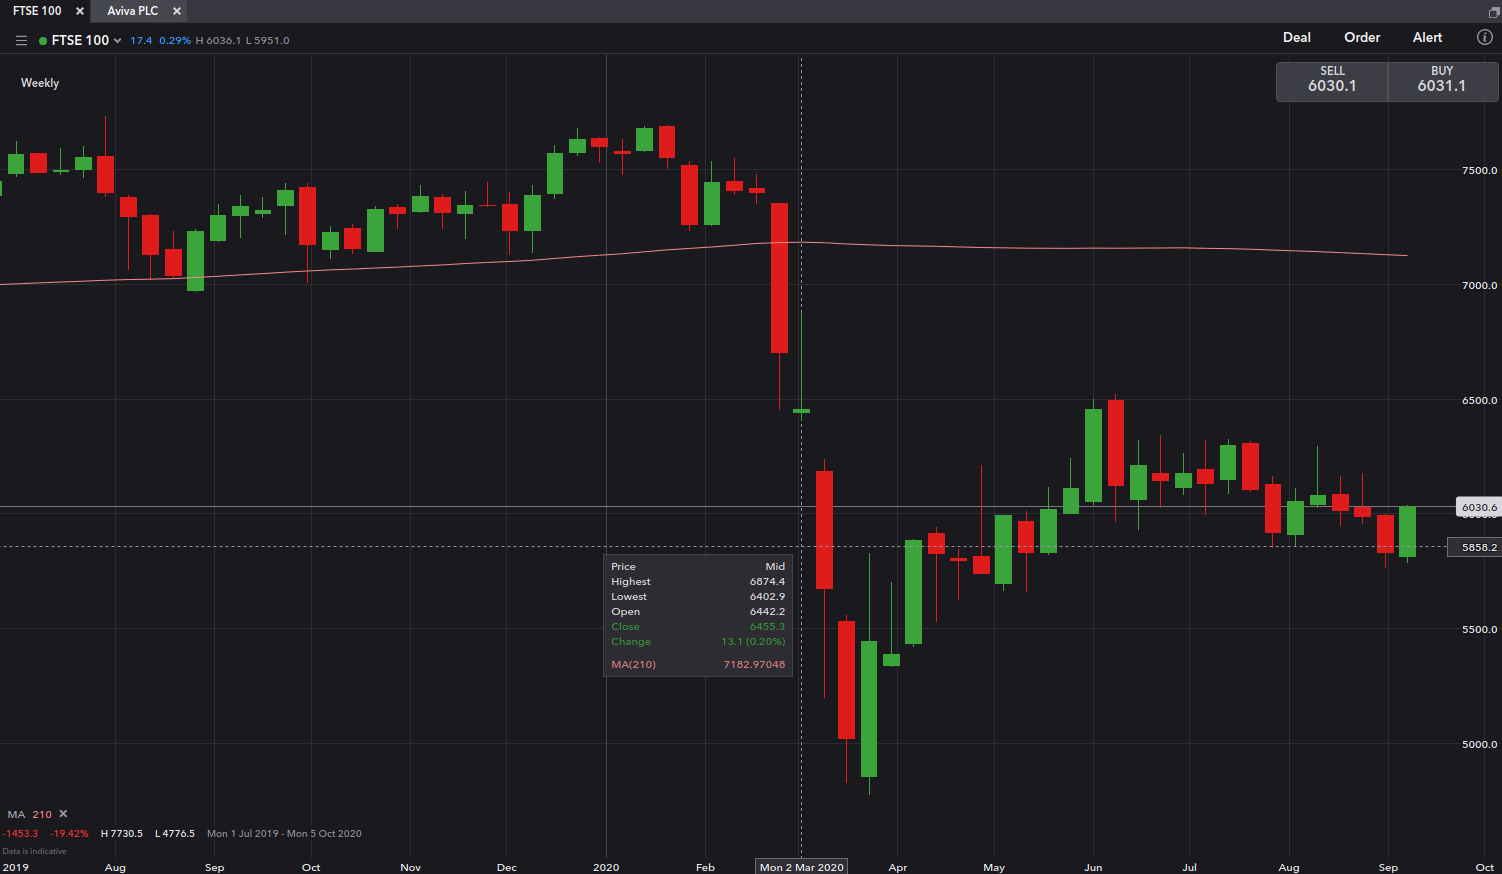
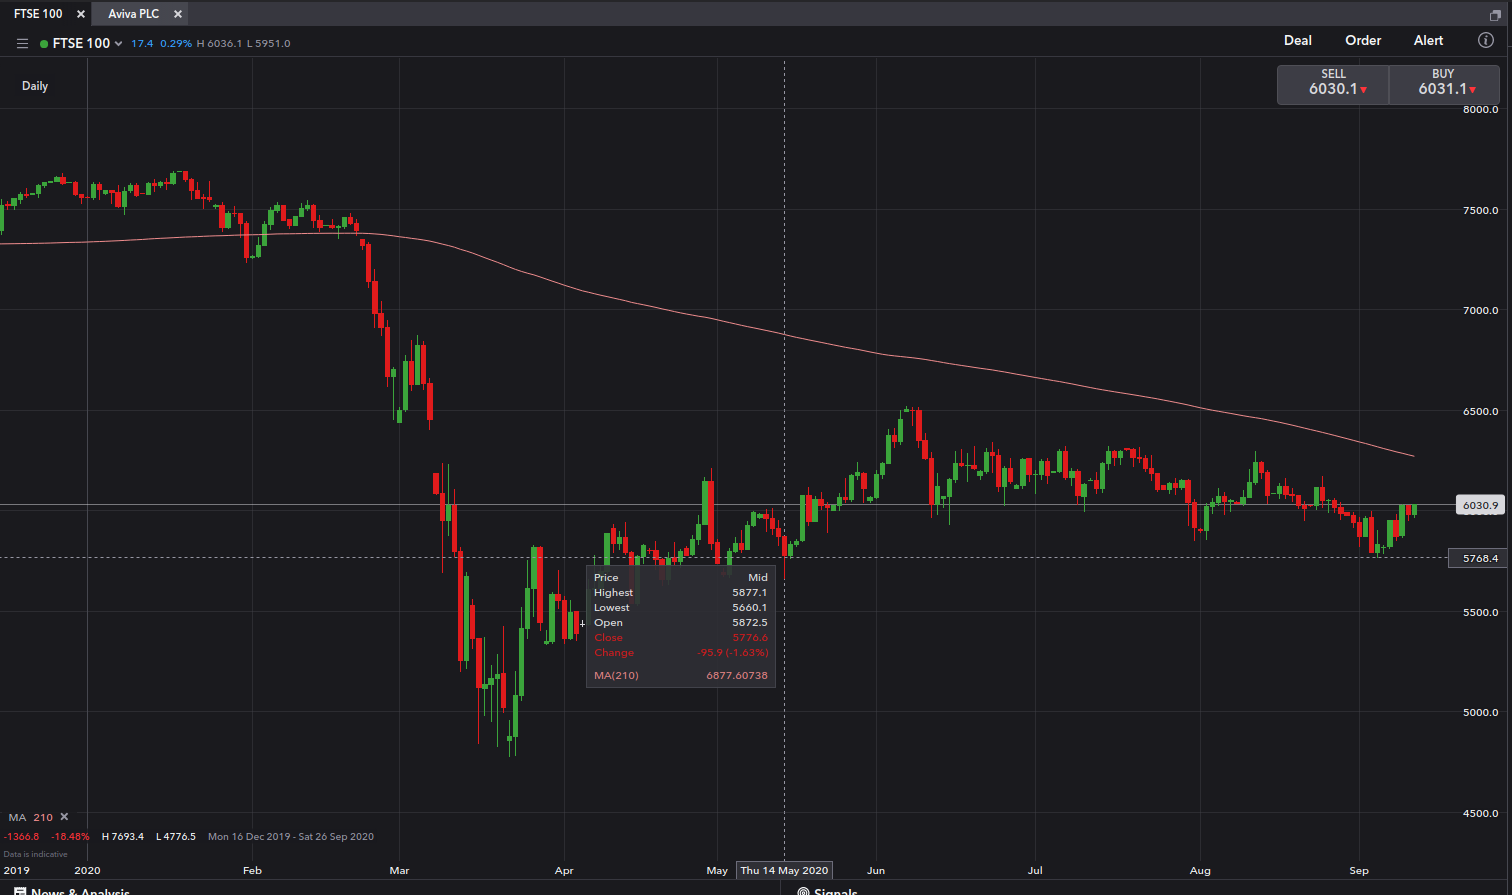
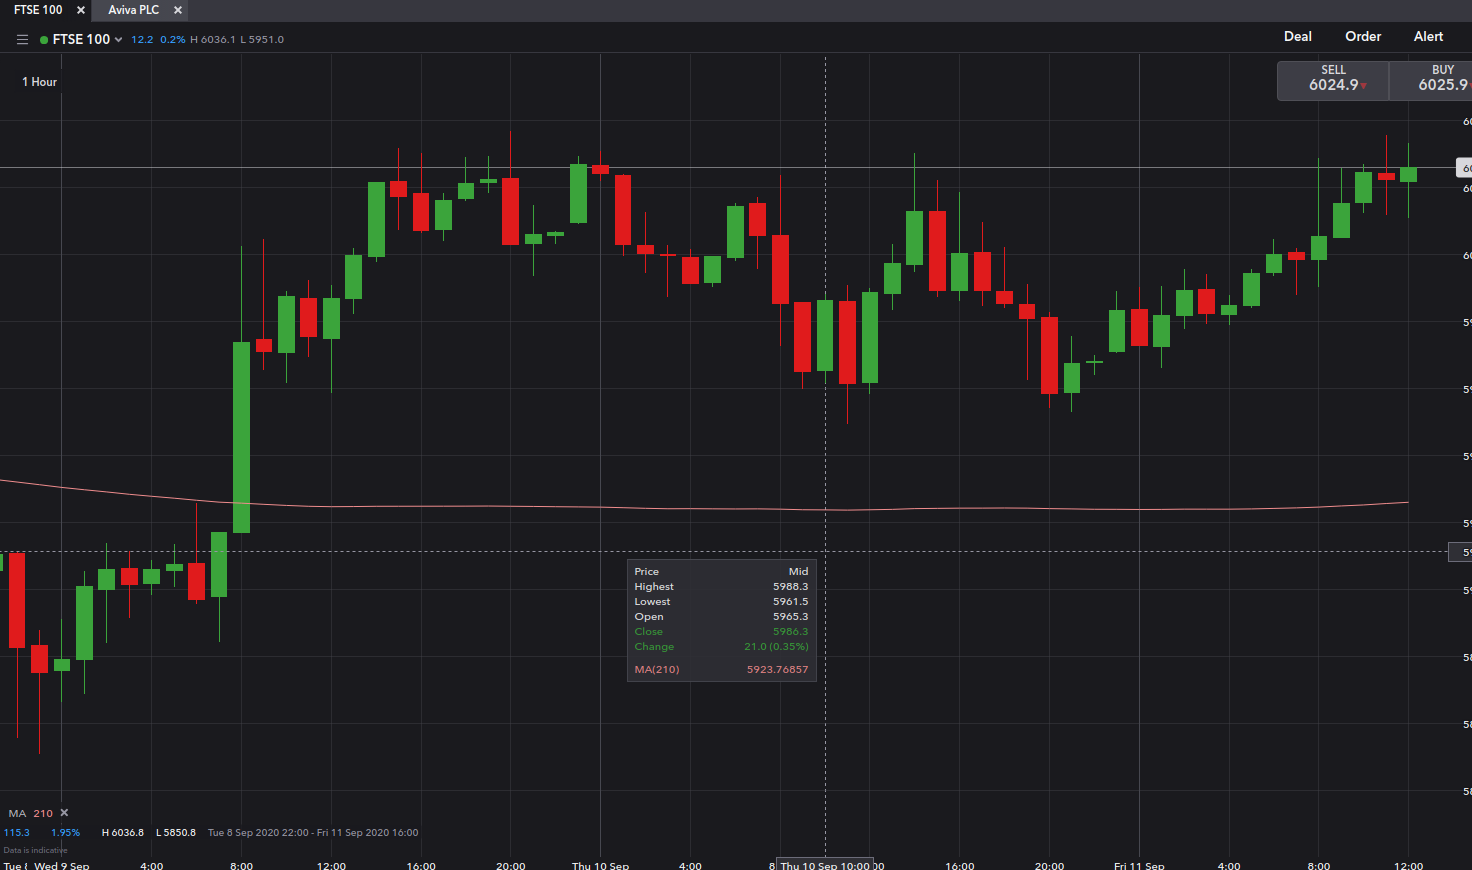
I've noticed that some prices can be either above or below the 210 Day MA line depending on chart interval selection (1 hour, 4 hour, daily etc.), but I'm unsure why this should be the case. I use the charts on IG's website and have selected 210 Day MA to align with 30 Week MA used in Weinstein's stage analysis.
I apologise if I'm being dense or missing something that ought to be obvious but can anyone explain the reasons for this?
Regards,
Ian