In previous posts, I showed how to construct variance portfolio weightings for the Stockopedia 2021 NAPS selections. The stock weightings (derived from 2020 data and rounded to the nearest 5%) are duplicated here:
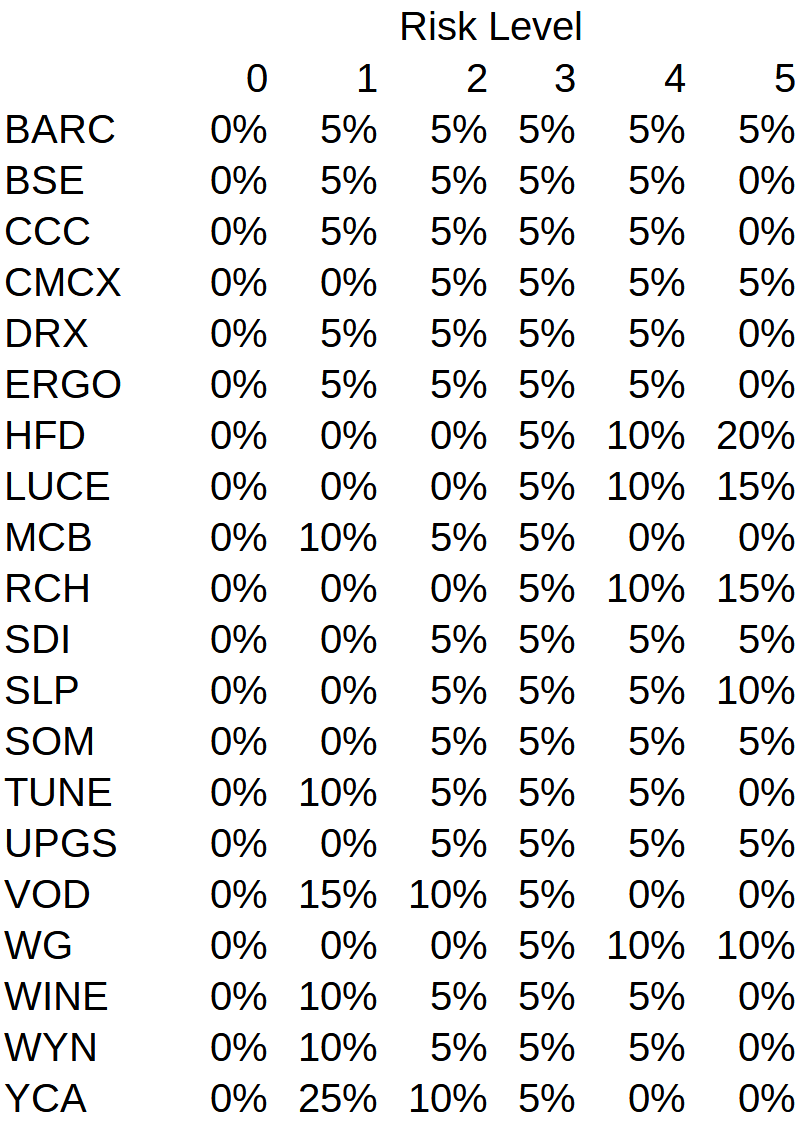
The set of weights an investor might choose depends on his/her appetite for risk. Note that the equal weight portfolio is included for those who wish to be risk-neutral. It was shown that by risk rebalancing (i.e., switching weights from one risk level to another depending on specific criteria) and stop-loss inclusion, a superior portfolio performance could be obtained.
In the findings summary in the last post, I indicated that: “...it suffices to say that the switching mechanism might work best when stocks are chosen that give rise to variance portfolios that are least correlated as this would provide a greater potential for one variance portfolio to outperform another.” In this post, this assertion is put to the test.
Typically, one might have, say, 100 candidate stocks from which to choose, let’s say, 20 stocks, as is done for a NAPS portfolio. From combinatorics, there will be 100!/(20!x80!) ~ 5.36 x 10²⁰ different portfolios possible. For illustrative purposes, I shall choose a computationally less intensive problem. The question posed is this: ‘Given the 20 stocks in the 2021 NAPS selection, how does one construct a portfolio of just 10 stocks with the best potential from the 20 suggested?
Naturally, one is restricted to using only 2020 data. Selecting 10 stocks from the 20 means that there are 20! / (10! x 10!) = 184,756 possible stock combinations. Rather than cycling through the full 184,756 combinations, I begin by choosing a random collection of 10 stocks. Each stock will have their price data and their daily returns. From the variance of their daily returns, one can construct the variance portfolio weights associated with this collection of stocks and thence the daily returns for each of the five variance portfolios. A moving average of say, 40 trading days, is then applied to the variance portfolios’ daily returns. The correlation matrix of this moving average allows one to rank this particular collection of stocks with the criterion that “...variance portfolios that are least correlated as this would provide a greater potential for one variance portfolio to outperform another.” The least correlation best outcome for a…