New Year NAPS - top stocks for 2016 and a few revelations
My 11 year old son turned to me a few days ago and asked the most wonderful question… “Dad, have you got any New Year’s Revelations ?” Aside from the sheer pleasure of the phrase, his comment really has got me thinking. What indeed did 2015 reveal ? And what should we resolve to take forwards through 2016 ?
For those who are new to the Stockopedia site, we’ve been on something of a journey in the last 12 months. Back on January 1st 2015 I selected the two highest ranking stocks in each sector according to their StockRank. This set of 20 stocks we titled the “New Year Naps” for reasons you can read up on in the original article. It was essentially my way of using a rules-based process to select some high expected return stocks without relying on any subjective decision making.
Amazing as it may seem, this very much mechanically selected set of stocks returned 43.4% in a year in which the major stock market indices sagged. As we’ve followed the strategy in various posts, the interest in the process has grown, which nudged me to run an hour long webinar last month reviewing the results, and the impact of diversification and rebalancing. You can catch up with the video here, transcript & performance results here and community discussion here.
So I now find myself in the rather precarious position of having set a precedent and I feel a duty to publish a similar set of 2016 NAPS. But before I do I’d like to invite readers to spend some time pondering with me about the nature of performance, process, skill and luck.
A brief 2015 performance review
Let’s put the 43% NAPS performance in perspective. The FTSE Small Cap index returned 5.8%, while the top 10% highest rated UK shares by StockRank returned 22%. Our selections have beaten the small cap benchmark and the general high StockRank peer group by a substantial margin.
As to individual stock performances, the following chart shows that two of the stocks more than doubled - International Greetings (LON:IGR) and Dart (LON:DTG) ; 4 others returned more than 50% - Adept Telecom (LON:ADT) , Character (LON:CCT) , Cohort (LON:CHRT) and NWF (LON:NWF) ; and only one stock fell… £LAMP with a -17.8% decline.

So last year’s New Year NAPS have done exceedingly well. In fact they’ve done far too well for my own liking. It’s at this point that I feel the need to throw some cold water on the fire as I think the exceptional performance may be sending out the wrong signals to subscribers.
We need to recognise that a lot of this out-performance may have been driven by luck… and luck is unsustainable.
The difference between skill and luck
One of my favourite investment writers is Michael Mauboussin, Head of Global Investment Strategies at Credit Suisse. I own several of his books and especially recommend “More than You Know” for any serious investor’s bookshelf. Chapter 1 discusses the difference between skill and luck by considering the interplay between process and outcomes. Have a look at this matrix:

Mauboussin states that “in too many cases, investors dwell solely on outcomes without appropriate consideration of process.” Blindly copying last year’s NAPS process just because it did well is not necessarily wise. We need to think very critically whether the positive outcome was really down to a good process (and therefore deserved success), or down to a risky process (and therefore just dumb luck).
Recognising the good risks and bad risks taken
Let’s take a closer look at last year’s selections and see if we can find the hidden risks in our process that may not be immediately evident just looking at the rules. A useful framework for understanding any portfolio is to break the selections down by style, sector, size and geography - so here goes.
1. Styles - Quality, Value and Momentum - good risks to take?
The core of the selection process was to use our proprietary Stockopedia StockRanks. We’ve had a lot of new subscribers since Christmas so it’s worth reiterating how they are constructed. Every day we score every share in the market against every other across three major dimensions:
- Quality - how profitable, cash generative and stable the company is
- Value - how cheap the stock is across 6 common price ratios
- Momentum - whether the share price and sentiment is improving
Now our methodology is certainly not foolproof, but it’s built on the shoulders of giants. Decades of academic research into the factors that have paid off in stock markets have helped to clarify ‘what works’ and we’ve aligned our process with these findings. If the future rhymes with the past, then groups of high ranking shares should have a good chance of beating the market (on average over the long term), while groups of low ranking shares may well underperform.
Since we launched the StockRanks nearly 3 years ago, we’ve certainly observed this behaviour - as can be displayed in the quite beautifully fanning performance charts below. The top ranked decile of shares (green) have dramatically beaten the bottom ranked shares (red).

But this performance trend shouldn’t be expected to continue indefinitely. So-called ‘factor investing’ across these quality, value and momentum traits doesn’t always work. Professor Andrew Ang explains in his book “Asset Management - a systematic approach to factor investing” that these factor risk premiums are a long term reward for the possibility of short term losses in bad times. And bad times always come. They should be expected.
Strategies based on each of these QVM factors have underperformed for significant periods of time in the past. Value Investing famously didn’t work at all well in the 1990s and deep value investing has been a disaster in the last year, meanwhile momentum investing has had a tougher time lately for many hedge funds and has famously ‘crashed’ at the bottom of bear markets. But research teaches us that one of the best ways to mitigate these risks is not to fall in love with either value or momentum investing on their own but use a blended value & momentum approach. The QVM StockRank is designed to do this, but of course by publishing it so cheaply we may be helping to kill the golden goose. Crowded trades around small cap value shares could be painful when bad times come.
Ultimately though investing is about taking on risks and earning a reward for it. Personally I believe buying good, cheap, improving shares is a good risk to take and I’m willing to suffer through the occasions that it underperforms. To me it’s a sound approach and certainly better than speculating on the alternative.
2. Sectors - spreading the risk
The diversification approach last year was to select 2 shares from each of our 10 major economic sectors. This was a blunt tool and has been somewhat criticised but has been very effective. The chart below shows that we’ve made solid gains across every sector, with notably strong gains in consumer cyclicals, industrials and basic materials. In a year when energy and basic materials stocks have generally been crushed our selection process somehow managed to generate strong gains in both those sectors.

We can also see in the following “super-sector” chart that defensive sectors have underperformed sensitives and cyclicals. An argument could be made that there is little need for investors seeking capital growth to invest in utilities, but this exposure didn’t hurt us in 2015 and will be maintained in 2016.

The risk we took by diversifying so broadly is that we’d miss out on the frenzy in some ‘hot’ sectors like biotechnology or cloud computing. But majority of private investors get sucked into and stuck in hot sectors at precisely the wrong time. There are hundreds of thousands of private investors licking their wounds due to their over-exposure to the energy sector right now. The ‘super-cycle’ myth drew them in and bottom fishing has burnt them further. We are all human beings, hard-wired to be suckers to a good story, and let’s be clear - the media and those that pay them know this. By diversifying consciously across sectors our aim was to mitigate some of these risks and I think we did it successfully.
Can we push our sector diversification further though? It’s worth noting that selecting 2 stocks in each sector can often select both from the same industry group. Dart Group and Wizz Air are both ranking highly right now and we don’t want to be over-exposed to airlines. There’s the old joke - “How do you become a millionaire? Become a billionaire then buy an airline.” Every sector contains lots of industries, so this year, we’re going to ensure there is only a single stock selected from any one industry group.
3. Size - micro-caps a risk too far ?
The biggest risk I believe was taken in the last year was selecting so many micro-caps. In the original rules I put a market-cap floor of £20m on the selections - refusing to include any companies smaller than this mark. My experience with sub £20m stocks has not been pretty as liquidity can dry up so fast amongst the tiddlers in the market.
But that was the only constraint I added - ten of last year’s selections had market capitalisations below £150m, and a quarter of them were below £50m. The chart below shows just how much of the performance to date has been driven by the micro-cap tiddlers from the original set.

There’s a saying in microcaps “they’ll let you in but they’ll never let you out!”. You can almost guarantee that when you want to sell them will be the same day as everyone else. Investors in DX Group this year found out what happens when everyone wants to sell on the same day - with the stock dropping 75%.
So in 2015 the sub £50m cap stocks have powered our returns. But was this a naive and foolish risk to have taken? It’s been a reasonably good period for solid small caps, so the wind has been in our sails, but what if it hadn’t been? If small and micro caps had suffered the picture could have been very different.
Some will say “if it ain’t broke don’t fix it”, but if we can recognise the risks in our process, then surely we can create a better design. In 2016 a key change has to be to diversify more evenly across capitalisation bands and ensure broader exposure to small, mid and large cap stocks.
4. Geography - is the UK the biggest risk of all?
We’re an international stock market analysis site but the NAPS list was completely focused on UK shares. Is this really wise? Frankly no it’s not. The UK is poised for a referendum on Europe and macro uncertainty looms large. Diversifying across geographies is something we are constantly advised to do but so few of us seem to do it.
It’s a fact that most investors stick to the stock exchanges closer to home due to familiarity, but it’s now easier than ever to invest in equities on foreign exchanges. Brokers are getting cheaper, with broader coverage, and Stockopedia now offers coverage across all European and US markets (with Asia and Australasia coming soon).
In my own portfolio I’ve invested across European and US equities to considerably boost performance and it’s something I’ve been considering for the NAPS Portfolio. But given we’ve been benchmarking to the FTSE indices and the majority of subscribers are on UK only subscription plans, I’m not going to spread the 2016 selections internationally. But we’ve clocked this as a hidden risk, and we may though follow up with US & European NAPS portfolios in due course.
A brief interlude - were the NAPS an unrepresentative sample?
The best way to consider if we got lucky is to compare our hit rate in selecting winners in the NAPS versus the underlying hit rate of selecting winners in the high StockRank bucket. The NAPS last year somehow managed to select 19 winners out of 20 stocks which is a 95% hit rate. But over the last 3 years the hit rate for picking winners amongst 90+ StockRank stocks has been 70% as illustrated in the following chart.

We can only therefore conclude that the NAPS got lucky. They were not a representative sample from the underlying population. So luck and good timing has definitely played it’s part. This 95% winner hit rate I can almost guarantee won’t be achieved again in the next year…. so let’s keep our confidence in check.
A good process or dumb luck?
So to return to our original Mauboussin inspired prompt - was our good outcome down to a good process, or just dumb luck ? I think if we’re really honest we can admit that there’s been a great element of luck, but that luck has come through at least part of the process being solid.
The StockRanks as the core of our selection process has driven much of the return and the sector diversification has helped to find stocks we’d otherwise never have considered. But our micro cap bias was either brave or downright foolish.
Reducing micro-cap risks further could make the portfolio more robust. While this may be at the expense of the kind of massive, eye-catching outperformance we’ve seen in 2015 it may help us to avoid catastrophic error if markets turn. “Elephants may not gallop” but they don’t get squashed either !
The 2016 NAPS Process
So in the light of the above investigation, for 2016 I’ve decided to diversify the selections across size and industries more broadly. The core of the process is very similar to the 2015 selection process, but there are several significant changes.
- Rank
- High StockRank - as high as possible and at least above 75.
- Size
- No microcaps - at least a £50m market capitalisation.
- At least 6 small caps, 6 mid caps and 6 large caps - to spread the size risk we’ll select a third of the portfolio from each of three size buckets - small-caps (£50m to £200m), mid-caps (£200m-£1000m) and large-caps (£1000m + ).
- Sectors
- 2 from each sector - to spread selections across key economic drivers.
- No more than 1 from each industry group - to minimise single industry risk.
- Liquidity
- Not too expensive to trade - a bid/ask spread of less than 5%.
Now these seemingly simple rule changes have actually caused me a huge headache. We can’t simply just select the top 2 stocks from each sector as I did last year. The top ranked stock in most sectors tends to be a small cap. If we select 10 small caps we’re way over our allocation to small caps.
So the process I’ve taken is to start with a list of all qualifying stocks in descending Stock Rank and move down the list filling up my sector, industry and size buckets as we go. An example NAPS stock screen is set up here, and I’ve also set up various sector specific screens. The construction has been a lot more time consuming than last year. N.B. We're planning on building a portfolio automator this year to do a lot of this work more quickly.
Finally we have taken a brief look at the latest news announcements for each share to ensure there has been no major corporate or M&A activity in the last month. Last year we selected Catlin which was in the middle of buyout negotiations which was a bit of a waste as it was delisted in April. Pure Wafer is currently one of the highest ranking shares in the system, but the company has just announced it is disposing of all its operations and becoming an investment company. Given the change in business it’s prudent to avoid as the historic numbers will now be meaningless for the future direction.
The 2016 NAPS Selections
Before I start I must reiterate from last year that these are not ‘tips’, in fact they are anything but. The following list is solely the output of the above rules based process, with one fiddle at the end as you’ll see. We hope our process is sensible, but there are always unknown unknowns. We have not performed any more analysis on these shares other than what the Stockopedia algorithms have performed and a cursory look at recent announcements. That will likely scare the living daylights out of any sensible investor - so please DYOR in your own investing and treat this as educational and informational only.
I’ve added links to Paul Scott’s archives where available for those wanting some community insights, and thanks to Ben Hobson and Alex Naamani for their help with the data and company briefs.
Industrials
Dart Group - Airline and logistics business Dart Group was a major success for the Naps portfolio in 2015. But despite nearly doubling in price through the year it continues to be one of the highest ranking companies in the market for its combined quality, value and momentum. The shares have seen a particularly strong run over the past year which of course implies the possibility of a consolidation period. We’ll be hoping for a continuation of current momentum.
Latest report said "the Board is optimistic that current market expectations for the full year will be achieved”. Mkt Cap: £869.6m, StockRank: 99. (Paul Scott archive)
Alumasc - The second industrial selection is Alumasc, which makes building and precision engineering products. They produce specialist roofing, walling, waterproofing and energy management systems. Its shares went on a blistering run late last summer but then gave up those gains on a fairly mixed trading update. It scores well on some very strong quality and momentum characteristics, though Paul Scott doesn’t like the potential negatives of the pension deficit at all.
Trading statement: "We have seen some evidence that capacity constraints within the construction industry generally have caused delay to some projects. While this may have an impact on timing, we continue to believe that management's expectations for the group's full year financial performance will be achieved." Mkt Cap: £63.3m, StockRank: 99 (Paul Scott archive)
Financials
H&T Group - High street pawnbroker H&T Group was a latecomer to the Naps portfolio last year because it was brought in after the original selection Catlin was delisted. H&T continues to be one of the highest ranked stocks in the Financials sector. The shares traded in a narrow range through much of 2015 but brokers are forecasting an improving profit trends over the coming year.
Latest statement: "Allowing for the recent reduction in gold price, we currently expect the full year results to be broadly in line with current market expectations." Mkt Cap: £72.6m, StockRank: 99. (Paul Scott archive)
Inland Homes is a new entrant to the Naps portfolio for 2016. This housebuilder and brownfield developer has been the focus of attention of many small-cap investors in recent years. As a result, the shares have seen some strong price momentum. Yet Inland also boasts some robust quality characteristics and its shares don't appear to be overpriced.
Latest Statement: "we have every confidence in delivering further significant progress in the current financial year." Mkt Cap: £175.4m, StockRank: 98. (Paul Scott archive)
Consumer Cyclicals
Character Group - A selection in the first Naps portfolio, children's toy maker Character once again qualifies as the top ranking consumer cyclical this year. Its quality and momentum rating are exceptionally strong. Character saw its profitability jump last year, with margins and cash generation improving noticeably.
Latest statement: "The profit before tax in 2015 is ahead of results previously anticipated and we are pleased to report that current trading remains encouraging and in line with management expectations."Mkt Cap: £100.1m, StockRank 99. (Paul Scott archive)
Cambria Automobiles. The past three years have been very good to auto dealers. Low interest rates, higher employment and signs of rising incomes have all been a boost to new car sales. It’s a highly cyclical sector but the macro picture doesn’t show any signs of worsening, even if rates were to edge up. Cambria has strong asset backing and has seen its earnings forecasts consistently upgraded through 2015 as it beat expectations.
Trading statement - "The Board has been very pleased with the manner in which this business has integrated and is confident that it will continue to deliver results in line with expectations." Mkt Cap: £82.5m, StockRank: 98. (Paul Scott archive)
Energy
NWF - With oil trading at less than $40 a barrel at the turn of the year, the near term prospects for energy stocks seem hardly appealing. Yet some shares in this sector have performed well over the past year despite macro challenges. One of them is NWF, which got an honourable mention in last year's Naps. This agricultural and distribution business supplies feed, food and fuel across the UK. Last year it showed all the signs of being a contrarian value play. Since then, an improving financial performance has reshaped its profile as a high quality, strong momentum small-cap.
Latest trading statement: "The Group reports that trading for the half year ended 30 November 2015 was in line with the prior year and the Board maintains its full year expectations." Mkt Cap: £93.9m, StockRank: 99. (Paul Scott archive)
John Wood - Oilfield engineering firms are some of the first to feel the effects of energy industry budget cuts but John Wood has fared better than others. Internal cost savings look set to keep earnings guidance on track for this year, while acquisitions continue. The group claims a strong balance sheet and resilient cashflow generation that should fund a double-digit percentage dividend increase.
Latest trading statement: "Our overall outlook for 2015 remains unchanged and we anticipate full year performance in line with previous guidance”. Mkt Cap: £2.32bn, StockRank: 94.
Technology
Computacenter - IT infrastructure company Computacenter was another addition to the SNAPS portfolio when it launched in the middle of last year. Back then its ranking factor made it very much a quality + value play, but a strong price trend and improving earnings forecasts as a result of a refocusing within the business have driven this towards momentum investors.
Latest Statement - "The outlook for the Group's trading result for the whole of 2015 remains in line with the Board's expectations which were upgraded at the time of our interim results, despite continuing significant currency headwinds." Mkt Cap: £1.05bn, StockRank: 98.
TT Electronics - this company makes hi-tech electronics that are used in precision engineering and manufacturing industries. Early last year it launched a project to improve its efficiency and build profitable growth. Although brokers are still to make earnings forecast upgrades, TT’s StockRank has risen from 78 to 91, suggesting that the turnaround is working. Certainly the shares have recovered well from a sharp dip last autumn.
Latest statement: “General industrial markets have become weaker in recent months, and we therefore remain cautious about market conditions. Our outlook for the full year is unchanged." Mkt Cap: £256.7m, StockRank: 91. (Paul Scott archive)
Basic Materials
International Greetings - The gift packaging and stationery supplier saw its price more than double in 2015. As an honourable mention in the inaugural NAPS portfolio, it now takes the main position in the Basic Materials sector for 2016. High quality and strong momentum are its strongest suits, but the valuation remains reasonable, particularly if the growth trends continues. The company hasn't seen any major upward earnings forecast revisions since early last summer, but a modest recent uptrend in expectations may signal increasing confidence that the company has more to deliver.
Latest report: “We have experienced continued improvement in performance in the key US market, whilst all other regions are also trading fully in line with expectations." Mkt Cap: £109.6m, StockRank: 98. (Paul Scott archive)
Castings - Our own small-cap expert Paul Scott is a big fan of this West Midlands engineering and machining company. After a strong performance in 2014 the shares lost ground in the first half of last year but later recovered. The company produces generally consistent and predictable results and has a strong balance sheet that should help withstand economic fluctuations.
Latest statement: “It is anticipated that the profits for the full year will meet market expectations, unless there is a sudden and unexpected change in the economic climate that would affect the outcome.” Mkt Cap: £208.1m, StockRank: 93. (Paul Scott archive)
Telecoms
Manx Telecom - Last year’s main telecoms selection for the Naps portfolio was Adept Telecom, which performed exceptionally well. Of course a rising price has driven Adept’s Value Rank down to the point where it no longer qualifies. In its place comes Manx Telecom, a communications firm based in the Isle of Man. Its shares enjoyed a re-rating last autumn as brokers upped their earnings forecasts.
Trading statement: ”Current trading remains on course to deliver a result for the full year in line with the Board's expectations." Mkt Cap: £237.2m, StockRank: 95. (Paul Scott archive)
Alternative Networks supplies IT systems and networks to business customers. The shares fell sharply last autumn on a trading update but quickly recovered. At the time, brokers did cut their earnings growth forecasts, but this a growth stock where expectations are that profitability will leap ahead again in 2016. The stock doesn’t rank as particularly cheap but the quality and momentum scores remain high.
Trading Statement: “The first weeks of 2016 show signs that the momentum carried through from the fourth quarter is continuing and provides sound encouragement. " Mkt Cap: £234.8m, StockRank: 86
Consumer Defensives
J Sainsbury - Last year, the big beast defensive stock in the Naps portfolio was Imperial Tobacco which did wonderfully, but that changes in 2016 to supermarket group J Sainsbury. The past three years have undoubtedly been difficult for the UK's biggest grocery chains, and Sainsburys hasn't been immune. Tough competition has dented profitability, forced a reduction in dividends and sparked a group-wide strategy review.
Latest Statement: "Full year underlying profit before tax now expected to be moderately ahead of published consensus”. Mkt Cap: £4.98bn, StockRank: 95.
Hilton Food Group - a meat packaging company that saw a strong performance in its shares right through 2015. The stand out feature in the company’s StockRank is the strength of its Quality (96), where consistent, robust profitability appears to be underpinned by strong margins and return on capital employed. Paired with strong price momentum, Hilton is a high flyer, where the valuation appears full but not necessarily stretched.
Latest statement: "Overall, trading has been slightly above the Board's expectations." Mkt Cap: £388.0m, StockRank: 93.
Utilities
Drax - the energy production group was on the wrong end of changes to government regulation last year and its shares slumped as a result. Overall, the company scores well for its valuation despite slashed earnings forecasts and the balance sheet on face value remains strong. But the business is facing major issues, and is one that most investors will be giving the bargepole treatment. This is very much a contrarian stock and current difficulties are noted in its latest trading statement. "EBITDA outlook for 2015 reduced to reflect LEC removal announcement on 8 July 2015”, On the other hand, there’s one very successful investor we all know who’s a big holder - Neil Woodford. Mkt Cap: £993.0m, StockRank: 88.
National Grid is obviously a household name in domestic electricity and gas supply. Given that it’s a hugely followed large-cap FTSE 100 corporation, surging growth it unlikely. But brokers did edge up their earnings forecasts on the stock last November in response to news on cost savings initiatives and a potential sale of a majority stake in its gas distribution business. The role this stock will play in the NAPS team is as a solid defender, spitting off dividends and providing some spine (we hope). Mkt Cap: £34.66bn, StockRank: 84.
Healthcare
Indivior, the pharmaceuticals spin-out from Reckitt Benckiser, was absorbed into the “SNAPS” portfolio in the middle of last year. Its price momentum has slipped since then but brokers have been consistently increasing their earnings expectations. As a result, Indivior’s StockRank is underpinned by much stronger value and quality ranks. Though it must be noted that the Value Rank is very backwards looking and Indivior’s business is changing. This is one stock that our gut tells me to avoid… but it remains as we’re sticking ruthlessly to the numbers.
Statement: "Our performance in 2015 continues to run well ahead of our plan...this over-delivery against our original planning assumptions allows us both to reward shareholders with higher than expected profits”. Mkt Cap: £1.35bn, StockRank: 87.
Glaxo Smithkline - with the lowest StockRank of all this year’s NAPS Glaxo Smithkline just scrapes in. Mega-caps like Glaxo often make me fall asleep, but a presentation by Gary Channon, CIO of Phoenix Asset Management, at the 2013 London Value Investor Conference put GSK at the forefront of many investors minds. Gary has become a friend and subscribes to Stockopedia. He gave a presentation which neatly showed how if GSK maintains its market share, and global pharma spend doubles in the next 20 years, GSK should be valued at £32 today. He noted in the presentation that “A purchase at current levels £15-16 will return 14% per annum compound. We recommend it as a potential long term great.” It’s now trading under £14. Mkt Cap £66.4bn, StockRank 78
NB - As a footnote - it’s interesting to note the stocks that would have been selected if we hadn’t made our diversification rules stricter - we will call these the ‘honourable mentions’ this year… they tend to be small or micro caps. Wizz Air, Jersey Electricity , Gamma Communications, Sanderson, Animalcare, Treatt, Games Workshop and Robinson. If we have time we’ll keep track these stocks over the year and see whether our additional diversification constraints have indeed helped or hindered.
You can never remove yourself completely from the process
The whole point of the NAPS project was to try to remove our own subjective biases from the stock selection process - to make it completely rules-based, mechanical and passive. But as we’re seeing this is almost impossible. Someone has to choose the rules with which to invest by and there’s a lot of subjectivity involved.
There really is no such thing as ‘passive investing’. Every choice made to create a portfolio is an active one, whether we’re designing a FTSE 100 index tracker or a simple rules based personal portfolio both are active, conscious and therefore subjective processes. All we can do is try our best to stay dispassionate, manage our risks and not fiddle too much. By focusing on the downside we can leave the upside to the gods, and hope they grace us once again with their gifts in 2016.
Safe Investing for the year and do please share your own processes and thoughts in the comments below.
Disclaimer
This is not financial advice. Our content is intended to be used and must be used for information and education purposes only. Please read our disclaimer and terms and conditions to understand our obligations.

161 comments
Hi
While I concur with the rebalancing strategy I have not yet clarified in my own mind what level of frequency will work for my investing style. What I have found useful in the meantime however, and something which has helped me a lot during volatile market movements is the support of three of the Stockopedia tools: StockRank movers, Alerts and Chart Signals.
I find a regular examination of the 'StockRank Movers' screens under the 'Ranks' tab to be really helpful. I sequence through the rank scores and the 'this week', 'this month' groupings to spot which of my holdings have moved. Then I examine each and form a view: hold, add to, slice or sell. (you could also use this tool to look for potential buys).
My second tool are the SP alerts which I set quite tightly, allow to trigger, re-set and then react quickly after a second trigger.
Last tool is the 'Chart signals' under the 'Tools' tab. Again a regular scan of some of the options has proved fruitful, first to de-risk my current holdings, second to spot new opportunities.
I think these three are particularly complimentary with a re-balancing strategy and offer support in volatile market conditions.
Regards
Howard
I have really adopted the StockRanks system into my investment strategy. Everyone is different and I found better to work to certain criteria as opposed to my own ability to spot a bargain!
What I would say, is that the NAPS portfolio/StockRanks doesn't guarantee market-beating returns - nothing can! However the likelihood of them out-performing the market is greater, and thus will beat the market more often than not. Variance works for us and against us depending on the market/situation.
the naps would probably do well if there was no major events in the market like brexit, presendential elections etc. timing plays a keys also with rebalancing, but like ed said its not always feasible to keep rebalancing esp to keep up with changing stock ranks.
I like the idea of a naps, but my conclusion is that it wont work well in a changing market with lots of challenges
Yes - I'll be writing a big post for 2017 that includes some key findings from this year's NAPS.
This year's NAPS have been quite unremarkable year to date (up 2%)... but the July SNAPS are up over 15% in 5 months. In theory rebalancing more frequently should have an impact, but the question is one of cost. Spreads and commissions can eat returns, especially in smaller caps.
My theory is that market dislocations (like during Brexit) cause a big change in leadership. We saw a lot of rankings changing quickly at that time. Rebalancing after a market dislocation may be sensible, so that a portfolio is more aligned with new leadership.
Anyway, the Jan NAPS are up 46% over 2 years so it's not too shabby.
@catalogue - StockRanks do move... which is the whole point really. Prices, valuations, fundamentals all change - nothing stays static. That's why rebalancing is essential.
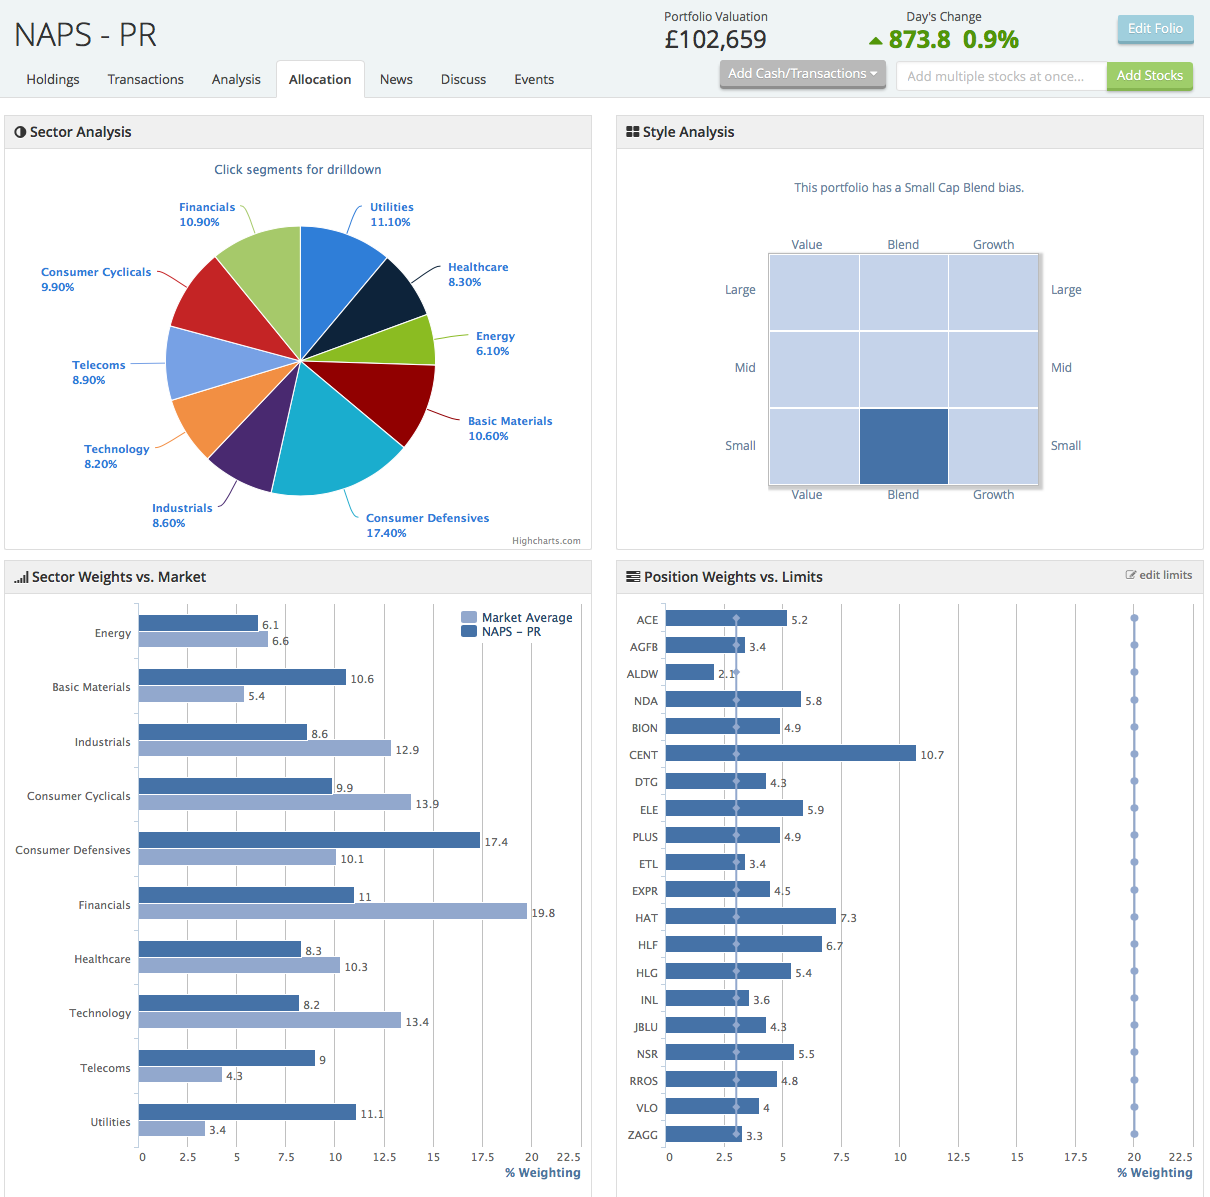
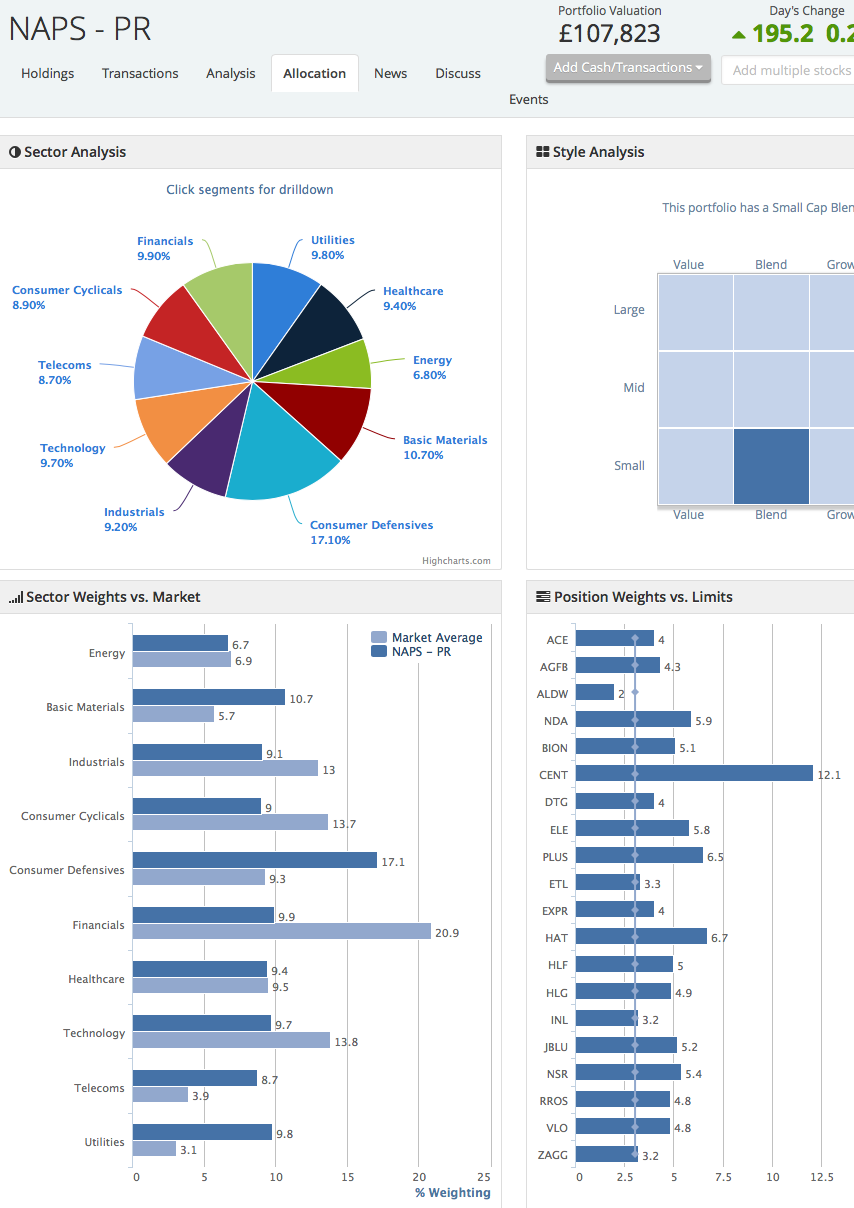
I posted the same portfolio on 31st May and 5th August. May was dire. This one is much improved compared with May but nothing like Ed's 2015 NAPS. Mine has not been rebalance or tampered with and is real so does not include stocks that you can't purchase on-line in the UK. Ed's 2016 includes Invidior, which was not offered when I was building mine and would surely have changed mine by a few percentage points. What is most significant is the change in stock rank over the year. Given that all selected stocks ranked higher than 85, 50% are now lower with INL at 25, ETL at 52, ACE at 69, ALDW at 74 and ZAGG at 76 - begs the question why should be fundamentals can change so quickly. Perhaps Momentum should be excluded because it is self fulfilling. If it gets marked down and gets sold its momentum falls so it gets sold more.
Hello,
Would it be possible to get an update on how well the Naps are doing?
Currently up about 1.5%
The NAPS are up about 2.3% year to date in my tracker before dividends. So it's not been a patch on last year's performance. They are also lagging the overall top decile of StockRanks which are up about 7.5% year to date.
The Snaps are up 12% since end June which would put the semi-year rebalanced portfolio up 7.6% for the year (excluding transaction costs and dividends).
The FTSE 100 is up 14% year to date. Many strategies have lagged the indices this year due to the preference for large cap exporters post Brexit.
I did a NAPs in early July it is up over 23%, it is mainly small to mid caps, 2 big winners are Avesco (LON:AVS) and Sopheon (LON:SPE), even without those 2 it would be up over 6%. My earlier NAPS have not really done anything in the last year.
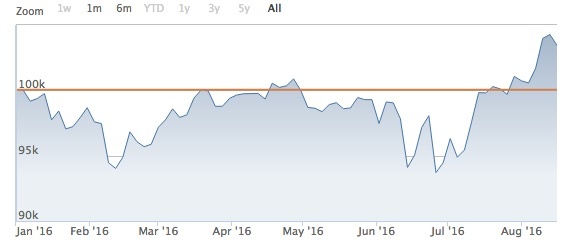
Nice to see the NAPS portfolio finally break out to new highs. It's up about 4% year to date. There are currently 9 winners and 11 losers in the portfolio, but the winners are doing better than the losers. Indivior is the best selection year to date - up about 60%.
It's been a much tougher year than 2015 for stock market investors & the StockRanks in general - the market is in a state of churn and leadership is changing. But it's good to see that our diversification strategy has continued to add value.
The NAPS have outperformed the top decile of StockRanks again, and since inception in January 2015, the annually rebalanced portfolio has returned more than 50% including dividends. That's a pretty solid return given the FTSE 100 has only managed 5% in the same period.
I last posted this portfolio on 31st May. I have not touched it since to give NAPS a fair chance. There is nothing that particularly stands out as an obvious error. Like Ed's NAPS of last year a couple of winners have saved the day. As a whole, so far, it seems to have followed the market and has performed poorly compared with Ed's NAPS. The sector allocation was obviously even at the outset and all selections had a stock rank greater than 90.
The selection method followed Ed's webinar as precisely as possible and as close to the beginning of the year as my broker could trade.
Any comments would be welcome.
I read your assessment of the 2015 NAPS portfolio, wherein you suggested that perhaps the excellent results were due 50% to luck and 50% to the “system”.
So I produced my own list using your amended “rules” about a week before you published 2016 NAPS. The only “rule" I ignored concerned only having one company from the same industry*. I thought it would be a useful exercise to follow the progress of both portfolios.
I was gratified to note that of your list of 20 equities I had managed to pick 13 that were the same! However, whereas you had selected Hilton Food, GlaxoSmithKline,
J Sainsbury , Indivior, Alumasc, Castings, and Cambria Automobiles,
instead, I had included Highland Gold Mining. SkyePharma, Wizz Air Holdings*, Dart*, Treatt, Persimmon, McBride, and Craneware.
On 29 May 2016 NAPS showed a loss of £746 on a £40K portfolio, whereas my NAPJan16CRG portfolio indicated a gain of £1475 (without dividends). The difference, £2,221, can only have been attributed to the 7 different shares in each portfolio…and it is not an insignificant sum.
I noted that, by inspection of the Value, Quality, Momentum and StockRank figures for each line of the respective portfolios that my NAPJan16CRG portfolio seemed to have some lower “Value” figures. So I worked out the average V, Q, M and StockRank figures for the 20 equities in each portfolio and found certain differences:
2016 NAPS - V= 72.2, Q= 80.7, M= 77.15, StockRank= 89.8
NAPJan16CRG V= 65.05, Q= 83.5, M= 82.75, StockRank= 90.
The average Value figures in my portfolio are lower by some 7 points, average Quality figures higher by 3 points, and the average Momentum figure is higher by some 5.6 points. Average StockRank figures are much the same.
Would it be fair to deduce, therefore, that one might better sacrifice VALUE for some QUALITY and MOMENTUM if the result might produce a gain of some £2.2K in a £40K portfolio, over 5 months? Or was it just pure luck!
R Geach
It's far too small a sample (in time and number of stocks) to draw any conclusion.
"On 29 May 2016 NAPS showed a loss of £746 on a £40K portfolio, whereas my NAPJan16CRG portfolio indicated a gain of £1475 (without dividends). The difference, £2,221, can only have been attributed to the 7 different shares in each portfolio…and it is not an insignificant sum.
I noted that, by inspection of the Value, Quality, Momentum and StockRank figures for each line of the respective portfolios that my NAPJan16CRG portfolio seemed to have some lower “Value” figures. So I worked out the average V, Q, M and StockRank figures for the 20 equities in each portfolio and found certain differences:
2016 NAPS - V= 72.2, Q= 80.7, M= 77.15, StockRank= 89.8
NAPJan16CRG V= 65.05, Q= 83.5, M= 82.75, StockRank= 90.
The average Value figures in my portfolio are lower by some 7 points, average Quality figures higher by 3 points, and the average Momentum figure is higher by some 5.6 points. Average StockRank figures are much the same.
Would it be fair to deduce, therefore, that one might better sacrifice VALUE for some QUALITY and MOMENTUM if the result might produce a gain of some £2.2K in a £40K portfolio, over 5 months? Or was it just pure luck!"
I believe that the difference in performance was just pure luck. If you construct portfolios by selecting 7 shares at random from a population of similarly high-ranking shares you are likely to get big differences in performance of each portfolio after 5 months, simply due to the variability of performance of individual shares and the fact that 7 is too small a number of shares in a portfolio to diversify away that variability.
There are quite a few people who've messaged me to say that the original rules from the 2015 NAPS are performing much better than my tweaks this year.
My point though was to reduce risk. Hindsight is always perfect vision. The original NAPS rules have much higher weighting to microcaps... and that makes me nervous. This year's set have more large caps and broader diversification - one of the impacts of this is that it's a lower beta portfolio too. It may lead to less upside, but it reduces the downside risk.
The churn in leadership & factors we've seen since the beginning of the year has proven that it's right to be cautious in this environment.
Following on from being in a particular environment, Jim O'Shaughnessy linked to this blog post yesterday;
http://www.factorinvestor.com/blog/2016/6/1/a-factor-investors-perspective-of-the-economic-cycle
The post analyses factor investing over the last five decades, and appears to demonstrate that different combinations of the QVM factors have varying effectiveness at different stages of the economic cycle.
As the author notes, it is sometimes easier to determine exactly where in the cycle we are after the event..
I have noticed that nearly every portfolio constructed along NAPS lines has the same shape after a few months. You will have one or two stocks which are significantly up, one or two which are significantly down and the rest spread around middling performance. In other words very much a Gaussian (bell-curve) like distribution. Even though the best might be +30-40% and the worst -30-40% the mean performance is often very much smaller - perhaps only a few percent.
Given that overall performance is seemingly dependent on those one or two outliers it is extraordinary how often such a portfolio does fairly accurately track some invisible index of "good" stocks. For example my NAPS and the Stockopedia NAPS only have one stock in common but they have tracked fairly closely this year so far.
For example, "Questor" updated on their 2016 tips on Sunday and although I can't quite recall the exact figures the gist was something like -20, -6, -5, +5, +20, +20 for an overall +7% performance so far compared with FTSE achieving approximately 0%. But they did not acknowledge that with only six stocks in this portfolio their entire gain was due to "getting lucky" with the -6% stock not happening to be another -20% stock. Everything else cancelled each other out. To me, even their tiny portfolio is basically showing the identical Gaussian-like distribution upto sampling error.
Although it seems counter-intuitive, if you are following a NAPS strategy you should not use a stop-loss to try to chop off the worst performing stocks (provided their quality ratings remain intact.) The reason is that you will be building in a negative bias to the performance because you are only selling on a negative variance movement and never on a positive variance movement. (It is valid to sell if you have reason to believe that the Quality rating has fallen signifiantly as this affects the mean performance not the variance.)
The problem is that when you chop a stock which is down -20% (say) you might be cutting a stock which has just reached the extent of its downward move (perhaps due to some momentum or value effect) and will now recover +20%. If you sell it and replace it you are still hoping for a +20% gain from the replacement and its chance of doing this is just the same as the stock replaced (if it still meets your basic quality metrics). According to Ed's data that probability of rising versus falling is about 70/30 in good times and less in not-so-good times. But you just don't know for any individual stock what will happen.
If you believe that you can predict momentum moves then you might try to sell high-Q stocks in a downward trend with the intention to buy back in again when the momentum trend changes. However this is then no longer a NAPS strategy. The NAPS strategy (as I understand it) only sells to rebalance the portfolio. This mechanism works by locking in the underlying mean trend and explicitly tries to minimise the effect of variance (whereas a stop-loss does the opposite.)
I think that is true of NAPS done over the last year but the original NAPS did not look like that, it had very few losers and mostly winners thats why it was so successful.
That's true. In general the symmetry is around the mean performance, which was very high last year. But you still get the outliers on either side. (Mean is magenta, median is white, in the plot below).
Thank you Nick for the thoughtful response to the current situation. There are no absolute winning systems but it can often take years for some to realise that. The problem is that new investors read all the books and then slavishly follow the purveyors of winning systems and when it doesn't go the way they were led to believe they quit and often say goodbye to hard earned money. I like stockopedia because it saves me enormous amounts of research time but sometimes I despair of the hype, it is easy to say DYOR and then proceed with the promotion as if caution is a dirty word. If anyone is in any doubt about the markets mercurial action all they need do is go to the Guru screens and see how they have performed. Making money in a rising market is child's play but sideways and down can be expensive and painful. It is not difficult to pick out the wise long term investors on this site and very easy to feel the pain of a injured acolyte. We live in scary times the correction started in January is far from over in my book. I have absolutely no idea what is going on in todays market, it is far from predictable. An exit on the 23rd looks like a two year recession and even if we stay in Europe it is in a mess and who knows where we will be if Trump wins the day. This together with unknown effect of quantative easing makes climbing the wall of worry so much more difficult.
Nick - am interested as to how you created that chart ? To my eye some of those portfolios look like they are perhaps 3 to 5 stock portfolios ?
I wrote up the same concept a couple of years ago about how many stocks you should own in a portfolio... You can read it in this piece - http://www.stockopedia.com/content/how-many-stocks...
Basically the key point is that the more diversification you have in a portfolio, the more likely you are to end up with the return of the targeted decile. Ultimately the costs of investing in more stocks depend on the size of one's portfolio. Personally I always invest in a minimum of 25 stocks.... often 35. It makes the volatility of the end results lower.
Ed - they are not portfolios. It is just the individual NAPS 2015 stocks normalised to 1 at 2015-01-01.
Your piece about the number of stocks in a portfolio makes the key idea that you try to create a portfolio to reduce volatility and to reveal the mean return for your selection criteria. However conversely, there is no point worrying too much about the volatility of an individual stock. Even excellent quality stocks have a surprising amount of volatility - many good stocks will fall -20% and then recover +40%.
It drives people crazy because you can't help thinking "if only I could get in at the bottom and out at the top I would make significantly more money than if I just stay put". But that is the nature of volatility - it looks as if there are patterns but it is random and overall it sums to zero. If you try to play it you wind up "sampling" the underlying drift (mean return) of the stock while incurring trading costs.
There is a great analogy with the game of roulette. In roulette every bet has a house edge of -1/37 = -2.7%. So what is the "best" bet (assuming you bet at all)? Arguably it is 16 on RED, 16 on BLACK and 1 on ZERO. This bet returns 36 for a 37 stake regardless of the number which comes up, for a volatility of zero. Of course with a negative edge this seems crazy because it locks in a small loss exactly equal to the house edge every time. It reveals the underlying truth that in gambling you are trying to use volatility to give you a (temporary) gain. The higher the volatility the bigger the illusion. (Sucker stocks always have high volatility.)
In an imaginary version of roulette with an edge in favour of the player of +2.7% then a strategy which reduces volatility would make complete sense. Why risk a larger downside than is necessary - even temporarily?
On the stock market we don't know what the edge is and whether it is positive or negative, and it changes all the time. So reducing volatility not only reduces the bumpiness of the ride but it makes it a bit easier to see whether there is even an edge in our favour or not at the moment.
Of course I did say in the article that last year's set was a very lucky sample - a 95% winner hit rate. The average last year for the entire 90+ StockRank set was about a 70% hit rate for winners. This year it's about 50% (or perhaps lower). Mean reversion writ large.
Of course the good news is that most people will only tolerate average performance for 6-12 months, then they'll get bored and head off to invest in story stocks again - they'll get lucky for 6 months or maybe a year then lose their shirts. Meanwhile the QVM factors will just keep chugging along notching up unremarkable, but solid and compounding returns. Tortoise and the hair.
Ultimately patience is rewarded in the stock market - as Warren Buffett once said... "I don't look to jump over 7-foot bars: I look around for 1-foot bars that I can step over."
We never set out at Stockopedia to provide 43% compounded returns year in year out... I'd love that to be possible... but markets are much more efficient than that - capital swarms in wherever exceptional returns are found especially in today's fast information diffusion world. Arguably the NAPS may be suffering from that this year.
Yes I think you are right. But I see the Stockopedia performance top ranked shares also do go up sharply for about 1 year and then level for about 1 year, we are now near the end of 1 year of being level, I speculate that after the EU vote if we remain in that shares will take off again, so maybe its time to start buying soon. I have picked up a few recently on valation grounds like Henry Boot (LON:BHY) and Alumasc (LON:ALU).
Yes 43% is exceptional, I think many will be happy with 20%.
Hare?!
I have set up various dummy NAPS over the last year. June 2015 is -2%. The others are not doing that well, the only one that has performed fairly well is the value NAPS that is up 8% since December 2015. Value NAPS is the same as usual selection but exclude any that have VR below 70. Best shares are Hydro International (LON:HYD) +56%, Lighthouse (LON:LGT), +39%, Drax (LON:DRX) +38%, worst NWF (LON:NWF) -18%, Games Workshop (LON:GAW) -14%, Fairpoint (LON:FRP) -14%.
The Top Stockranking shares, which ignores sectors is up 5%, that was selected in December 2015 also. The normal Dec 2015 NAPS is up 4%.
Picking 20 shares at the same time there will be quite a bit of luck involved.
I would have been very content with a 1% this year :)
Perhaps the community might have suggestions as to what to do next. Liquidate, refactor, leave it for another month and then refactor etc.
Why not look at the reasons you bought and your rules for selling and see what changed. If you would still buy then stay with it or if your rules for selling have clicked in then sell. My portfolio is up 30% but it is the same one that was down about the same last year when I was in oils, mining and gold. My turn will come!!!
An update on my multi country NAPS shows that it should probably be cleared out as it has clearly failed. Worse still my total portfolio, like the market, has been lacklustre but well ahead of my NAPS experiment. NAPS has therefore skewed my overall performance. As of today NAPS is down 11.8%. There has been no change to the original selection. Sectors were selected to reduce risk but only Telecoms has two substantial losers, the others have a good and bad within their sector. Only 6 socks of the 20 are in profit. Four are down by more than 30%. Twelve of the stocks would not be permitted in my regular portfolio. While I can identify stocks I would not have bought, like ZAGG, a number of others like Agfa Gevaert and Jet Blue have been hit by market sentiment, as far as I can see. Fourteen are still ranked above 80 on Stockopedia. The selection was made according to the NAPS webinar. I more convinced than ever that QVM is a good starting point for a screen but then the hard work begins of combing through company reports and only then do you make an initial purchase and see how it performs before it becomes a core investment. I have some screen grabs of holdings and rankings etc. to anyone who is interested.
Everyone would definitely be interested in the holdings and diversification spread Catalogue. Maybe the community can learn something from your experience. Perhaps the performance has been hit by certain sectors, or certain size groups. Do share them.
I recently liquidated a 1 year long/short multi-country portfolio that performed extremely well - much stronger than the original NAPS from last year. My holdings were about 50% UK and 50% international. It's important to remember that each portfolio is a sample of a broader distribution - no one point case portfolio fully represents the average return of those in a strategy unless it's very widely diversified.
It's been a much tougher environment for factor investing since the beginning of the year than it was last year. The UK NAPS from this article have fallen by 1% - a considerable difference to last year's set which were up more than 30% by May 2015.
I'll be writing a fuller update on the NAPS soon.
Hi Ed
Good to hear that you will be reviewing your NAPs portfolio. I recreated this portfolio and tracked it from day one. Assuming a £10,000 deal and £60 of costs (this would be high as 9 of stocks would not carry stamp duty) it is down about 1.7%, which given the market is acceptable. What I don't understand is 55% of the holding, 11 trades, are on the losing side and yet the QVGM on 7 of them is still above 80% and the biggest faller ANL down 33%, is showing a ranking of 78. GSK on the other hand shows a rank of 68 is up 5%. Of the 9 winning trades 2 are below 80%. Does this tell us anything?
We know that a high SR is not a guarantee of performance but should, hopefully, be a guide to outperformance. I can see nothing in this analysis that confirms this view, or am I looking at a glass half full
Imagine that Spock heard about the game 'football' in space. He decided to visit earth and watch the best football team on earth - Real Madrid - to see what the fuss was about. He visits one game, Ronaldo's on the bench in crutches and they lose. Would he then return to the Vulcan motherlode to conclude that Real Madrid were definitely 'not the best football team on earth'?
Spock surely is smarter than that.
Investing is a long term game. A 6 month period is too short a time period to judge long term expectancy. We've seen the power of the StockRanks at work for the last 3 years - to expect the same returns as we had last year to occur every year would be an impossibility.
The 90+ StockRank set is up 1.7% year to date in the UK. The FTSE All Share is flat. The NAPS are down 1.7%. We can learn nothing from this 5 month data set that we don't already know. This year is young, we can judge it once it matures.
Thanks for sharing catalogue - we usually only get to see the winner's portfolios! Of the 11.8% fall, do you have a feel for how much of this is down to stock price movements and how much is down to transaction expenses? (FX, dealing costs, bid/ask spread). I've looked at gaining diversification by buying overseas stocks but as with dealing with some of the micro caps in the UK the associated costs are so high that you often need a 5-10% up tick in the stock price just to break even. Just sticking with generally smallish/mid cap UK stocks my NAPs is up about 3.5% YTD (or about 5% if I exclude dealing costs.)
Best,
Gus.
PhilH-Enjoyed reading your posts.Some interesting thoughts. However have to agree with herbie that from what I know about management Castings is not one you would have down for earnings manipulation.
Very straightforward team there.
Hi hayashi22,
You have to ask yourself this question ...
Do I have time to dig into each comapny to get to know them?
or
Do I accept that during the screening process there will be false positives (that may fail or succeed) and false negatives (that don't make the cut)?
I prompt for the latter as I can't honestly, hand on heart say that I can access the quality of a management team. I'd only be kidding myself! AND I've resolutely decided not to rely on anyone else to influence my opinion on that matter.
I can honestly say I know very little about the companies I invest in but I think (with the help of Stockopedia) that I've found a formula that works for me (even if I miss some nuggets or pick up the occassional duffer)
One big difference between the NAPS approach and my approach is that I cut losers, EXCEPT when there is a big wobble in the market where I sit tight for a while and wait for the dust to settle. Then I cut the stragglers
Best of luck
Phil
Thanks for the detail Phil...
Your obviously doing something right looking at your fund.
A couple of observations that would have prevented me from buying the losers back in January ...
Alternative Networks (LON:AN.) - Decreasing EPS estimates
Indivior (LON:INDV) - Historical EPS erosion
International Greetings (LON:IGR) - poor debt profile
NWF (LON:NWF) - I personally wouldn't have bought these as I look for cheap earnings growth PEG < 1
Not sure if that helps
Cheers
Phil
Hi Phil
Out of interest if you applied the same criteria to all the stocks would this have filtered out some of the gaining stocks too?
Hi gpacker,
Here's ones I wouldn't have bought ...
Dart (LON:DTG) ... PEG would have kept me out
H & T (LON:HAT) ... came up a lot on my screens but I'm not comfortable owning this business on ethical/moral grounds
Inland Homes (LON:INL) .. reducing EPS estimates for 2017 would have kept me out
Character (LON:CCT) ... I held Character shares in Jan 15 but wouldn't have bought then as PEG was too high and current ratio < 1.2 (but those issues wouldn't have made me sell)
Cambria Automobiles (LON:CAMB) ... current ratio < 1.2 and forecast PEG's for 2016 & 2017 didn't look great
John Wood (LON:WG.) ... yuk ... no EPS growth and declining EPS estimates
Computacenter (LON:CCC) ... poor PEG
TT electronics (LON:TTG) ... decreasing EPS estimates, excessive debt to operating profit
Castings (LON:CGS) ... High risk of earnings manipulation
Manx Telecom (LON:MANX) ... poor PEG
J Sainsbury (LON:SBRY) ... Altman score < 1.8, poor PEG
Hilton Food (LON:HFG) ... excessive debt to operating profit
Drax (LON:DRX) ... High risk of earnings manipulation, poor earnings growth
National Grid (LON:NG.) ... poor PEG
GlaxoSmithKline (LON:GSK) ... decreasing earning estimates, poor PEG
I might have bought ...
Alumasc (LON:ALU)
I'll dig out a list on Euro Naps I did at the start of the year in a Google Portfolio and post it later.
Cheers
Phil
What about Alumasc (LON:ALU) pension problem?
A bit surprised that Castings (LON:CGS) has high risk of earnings manipulation.
Re Hilton Food (LON:HFG), Net debt is about 10% of operating profit and it has £40m cash?
Re: Dart (LON:DTG) there is no PEG because no est. profit for 2016, however the forecast EPS growth for 2016 is +172% so I think the PEG will be quite low.
You can always find a reason not to buy a share.
Hi Herbie,
For better or for worse I don't dig into pension issues sacrilege to some I'm sure
Re Hilton Food (LON:HFG), my understanding is that the 'net debt' position in the stockreport includes the cash position and as such the 'net debt' in relation to operating profit is too high for me.
I can always find a reason to not buy lots of shares, but I'm looking for ones where the reasons are compelling and there are no red flags.
Best of luck
Phil
OK but Hilton Food (LON:HFG) is only £2.6m net debt and the OP is £26m, does not look that high to me. Also debt is falling and cash is rising. My problem with Hilton Food (LON:HFG) is very low margins and rely on a large contract with Tesco.
Phil this is a NAPS selection, its not something I have done either although I do own some of those shares, but its Stockopedia selection of the highest ranking shares in each sector, with a few tweaks this year, have you have read Ed's article on mechanical selecting? As for red flags I think Alumasc (LON:ALU) has quite a big one, something that Stockopedia does not tell you.
Hi Herbie,
re Hilton Food (LON:HFG) ... You're right. Quickly scanning through I've read the numbers the wrong way around. My mistake! Part of my buying criteria is increasing EPS estimates and that wasn't in place for Hilton Food (LON:HFG) in January.
Yeah I know it's a NAPS selection process ... I guess I'm suggesting potential improvements. So your mechanical selection criteria could include additional rules such as:
net debt < 3 * operating profit
increasing EPS estimates
PEGR < 1
etc etc
Also just because the standard NAP selections are the best available in the UK doesn't mean they are the best choices. Why not widen the pool from which you fish and find stocks that have no issues?
I agree it would be great if the Stockreport also included pension issues. I'm sure it's on the todo list.
Yes I agree about EPS, too often I look at high ranking shares but the forecast EPS growth is negative or low. I only bought Hilton Food (LON:HFG) because I wanted more in that section as I had very little else.
Yes the UK is not looking that good at the moment, problem with Europe is there are so many companies, then there are buying issues, some brokers don't cover many, as well as currencies issues and the Stockopedia upgrade is quite a lot more than just UK.
There are challenges with moving to a non-uk universe.
Once I'd made the decision I moved all of my investments from Barclays to YouInvest incuding my SIPP, my ISA and my wife's ISA.
There are a lot of companies in Europe but for me that's great. I can choose not to compromise on my investment style.
But fees are higher, even thought the broker might tell you that you can deal European stocks online I've found that most of the smaller companies I select aren't plumbed into online dealing. Plus there are forex charges, plus you can lose some dividends too due to taxation issues.
But for me it's worth it!
Even some big european companies like CPH:VWS have to be telephone purchased :(
Here's the link to the Euro NAPS I put together in January
https://docs.google.com/spreadsheets/d/1yUUat4d6QmUWd5iX4APmlX_QvcOY1hCmrMZgtix-lBY/pubhtml
Interestingly I did include both Manx Telecom (LON:MANX) & NWF (LON:NWF) and I think the reason is that in my screen I use risk adjusted PEG (PEGR) and I'm guessing that they were both below 1 back in January. I've no way of checking that looking at the historical stockreports.
I also included H & T (LON:HAT) but as I indicated I wouldn't have personally bought that stock.
Average performance was -3.34 % however one stock £QFG went ex-dividend in March paying a whopping 26% dividend. If the figures are adjusted for this then the average performance was -2.8%. That is set against a FTSE Eurofirst 300 performance of -7.9%
Jan and early feb was particularly brutal in Europe but things are recovering now.
Not sure if this helps but thought it was worth putting it out there.
Cheers and good luck
Phil
I think the tail wind if it comes will be after June, but not before. a half year snaps towards the end of june will be interesting
My tracking of the 2016 NAPS is showing a 1.9% decline (excluding transaction costs) - which is in line with the FTSE All Share year to date. There was a roughly 7% decline by February 11th, but it's clawed most of that back.
Only 7 shares are in positive territory... with Drax up 17%, Dart Group up 14%, H&T up 10%, and Sainsbury's up 8%. 4 shares are showing more than 10% losses INDV, IGR, NWF, and AN.
Last year's NAPS were, as I repeatedly stated, a very fortunate set - but there was also a strong tailwind that drove the share prices of the kinds of QVM shares we're targeting. Many of the indices posted strong gains between January and mid year and momentum was strong.
This year we're seeing churn in the markets as leadership rotates. UK indices are going nowhere and the market generally has taken a breather. There's no tailwind... in fact, with all the macro and referendum uncertainty there are strong headwinds.
When factor investing we should beaiming for 'market or better' returns.If the NAPS can post a positive absolute performance in this environment I'll be happy. Momentum is not in favour right now and investors have to be patient. Ultimately we're trying to harvest market rewards, but there can't be a harvest without sowing and tending crops. The best thing to do is to water the flowers, pull the weeds, and have faith the harvest will come eventually.
How does a tailwind help to grow crops?
Hi A
ive also removed Alternative Networks, NWF & International Greetings. anything heading into the -20% area for me will be removed from the portfolio and remains invested elsewhere.
I started my Naps in Jan 2106 probably a week before the crisis started this year, and my NAPs is down around -3.5%
the worst performers being NWF and Alternate Networks which I have removed.
I think for anyone who done the NAPS this year timing plays a critical part if your up or down. if you invested after late February its probably doing ok, if you invested before in Jan you will be down
ive since February also added some funds to create some stability in my overall portfolio, separate to the NAPs but still included in my ISA. these funds include:
Woodford UK equity down at -0.35%
Marlbough UK Multi Cap down at -0.25%
Lindsell Global equity up at 5.1%
Fundsmith Global Equity up at 4%
also added JPM Global Macro Opportunities this month.
the funds I'm going to keep long term for at least 5 years and judge performance then and top up regulary.
interested to know what funds if any people run also in their portfolios?
as far as the NAPs go I will review after Brexit in late June, and decide whether to rebalance anything. anything down at around -20% I will get rid off. not been a good start to the NAPs, but market conditions have been terrible. be great to see he NAPs push ahead and still outperform, but with brexit looming I'm wondering how much of a impact it will have and whether we could still see another downfall.
Hi Vik 2001,
Similar experience with 2016 NAPS for 1st Qtr - currently down c. 5.0% (excluding transaction costs) with poor performance in particular from Alternative Networks (-30.8%), NWF (-17.8%) & International Greetings (-17.4%). Interesting only Alternative Networks seen fall below 80 in stock rank - other two still well into top decile for sector. Followed NAPs strategy fairly closely though for various reasons flexed it a bit substituting Treatt for J Sainsbury, Hydro International for Alumasc, Jersey Electricity for Drax, Advanced Medical Solutions for Indivior and Animalcare for Glaxo Smith Kline (some of these stocks were in Ed's honourable mentions and all except Advanced Medical Solutions had very high stock ranks). This meant underperformed Ed's 2016 NAPs (estimate a -4.4% return since Jan 5th) as didn't hold two best performers - Drax (!) & J. Sainsbury though this offset by not holding Indivior. However both Ed's NAPs and my adjusted version underperformed the FTSE All Share which was down -1.1%. Only one quarter I know and in the interests of experiment (!) still holding all selections but with Brexit vote in June not looking good for the sort of returns Ed achieved last year. Perhaps a SNAPs selection at half year will be the answer this year especially if we vote out and share prices dive!!
I've done quite well from the NAPs system. Like many others I followed with interest the webinar and adjusted 25% of my portfolio to try this approach. Out of the 12 companies I selected so far only one company (GAW) is negative even with all the market issues we have seen in the first three months of this year. I've topped up once so far and will look to top up again after the EU vote, just in case. But so far so good. Its been very interesting and quite profitable.
You have done very well but when did you start?
All the NAPS (20 shares) since June have pick up a fair share of losers and none are making really making any money. The one in June, so 10 months old is down 2.5% inc. spread but not costs. 3 shares are down 30%+. The one in December 2016 is breakeven, 5 shares down over 10%. Ed's 2016 one is down about 2% and has 4 shares down over 10%.
So did you buy all 12 at same time and what rules did you use?
I personally I look at the make up of the score opposed to the total score. If I have bought a "high flyer" (+Q,+M,-V) I sell when it no longer fits that profile i.e. has become a "falling star" (+Q, -M,-V) or (-Q,+M,-V) cant remember that is called. Conversely if a bargain stock has turned into a "high flyer" I consider selling, but not always. If it becomes a "value trap" (+V,-Q,-M) I always sell.
A constant irritant in these kind of mechanical systems has always been when to sell. In nearly two decades of reading about the stock market I don't believe I've ever seen an decent answer.
Stock Ranks though might, just might, have got closer to the answer than I've seen before.
If, in a NAPS style portfolio, you demand a high Stock Rank before purchasing shares, then it follows (I think) that the Stock Rank could also be used as a sell signal.
I guess my question is what would that value be? 50 sounds sensible because it would then be aligned with the rest of the market (mean reversion?) but I'd be interested in other peoples opinion and justification.
Hi catalogue,
My commiserations ! If a week is a long time in politics, 6 weeks can seem an eternity, if you're unexpectedly under water on investments that you had such high hopes for ;-< !
I'd be particularly interested in hearing more about your US naps, since this isn't a market I've followed up til now ....and it would be useful to understand how (indeed, if !) benchmarks differ 'across the pond' from here in the UK.
Many thanks in advance
ATB
Like many I was fascinated by the NAPS experiment and carefully followed the rules, keeping the sectors but expanding the geography to end up with 20 European and USA stocks. I purchased them all at the turn of the year - not a great time! So far the portfolio is down just short of 12%. The worst is down 50% and the best up 5.5% so all that remains is to have the courage to hang on in there. Bar two, they are all ranked above 90%. The best performer of the day is now ranked at only 50 (it was in the 90s when purchased). More details available to anyone who is interested, although I would expect any interest to be schadenfreude in nature.
I have realised, with the benefit of 20-20 hindsight, that as well as using sector and mcap as diversifying factors, it is a good idea to stagger the date of entry of each stock in the portfolio, rather than buy into all the stocks at the same point. This acts in a similar way to the other factors; i.e. it searches for above-median performance after integrating out the factor in question (such as sector, mcap, or date of entry) but only when you take the whole ensemble into account.
I look to invest for up to 1 year.
I have found 150 MA to be a good proxy for the long term trend of a share. I used to use 200 but found this was rather slow for the time frame of investing that I prefer.
Interesting.
What sort of timeframe is 150 MA good for please.
NI
What is significant about 150 days, as opposed to, say, 100 or 200?
NI
I thought Ed indicated that he has been using stop losses and short selling to protect his portfolio. My faith in stops continues as it reviews weak holdings and encourages changes into better performers where necessary or indicates a stop has been hit on an issue that nonetheless remains strong and can therefore be repurchased.The cost involved of the spread and commission is a price to pay for the attention it draws to non performers. My dislike of shares that fall below their 150 day MA is from experience (not always correct) that there is innate weakness. I never buy a stock that is below this benchmark.
I understand your reluctance for stops at present but for peace of mind I always enter them and as indicated am prepared to buy back into shares that have been stopped. I do not allow myself to hold stocks that are below their 150 days MA.
my real life NAPs was up, but today its fell down to -4%
markets have been bad this week.
Edward is quite right that NAPS is not immune from market falls, the dummy one I set in June had all its profit wiped out today, it fell 2.3%, the one I set up in December fell only 0.4%, in fact that is ahead of the June one now but has only been going 6 weeks. I think in this market many high flyers are getting hit, so profit taking maybe the order or some topping up.
Why didn't RBS warn us nearer the market top?
Apart from the RBS report, many pundits have been very bearish in the last week. I notice that on the front page of Stockopedia the number of stocks trading under the 200 day moving average has reached 60% of the market. It will be interesting to see which strategies hold up this year.
I have sold some low conviction shares and certainly will be hedging my portfolio this year.
Having said that, good luck to everyone this year!
Ed,
what do you make of Soc Gen and RBS statements yesterday on a cataclysmic crash in 2016 and to sell all shares? Do you agree with their sentiment? Do you have confidence in the NAPS even if the market were to fall?
Firstly, I don't have a crystal ball and never do predictions.
Secondly, re.Soc Gen - Albert Edwards is always uber-bearish (even a stopped clock tells the right time twice a day). I've printed off his latest. I haven't seen RBS's.
Thirdly, stock markets always crash. It's to be expected. Market timing is very hard, but certainly when 12 month indices are showing negative returns some famous trend models (such as Gary Antonnaci's Dual Momentum Timing Model) might say "stay out of equities till 12 month returns are positive".
But fourthly, my opinion is that owning shares should never be a binary decision. We don't have to be either long or out. We can be long and hedged. It's much easier to unwind a hedge than to buy back in. Hedging is easy these days, either buying FTSE puts or selling short stocks, ETFs or indices on spread betting portals.
Fifthly, I am always as nervous as anyone, so I remain quite hedged. As I was in 2015.
Sixthly, the StockRanks (and thus NAPS) have done well even as the market has declined, but that can't be expected to continue. In a steep market decline then we'd have to expect a steep NAPS decline. Just because they haven't corrected yet doesn't mean they won't. We should expect 20-30% drawdowns as standard every few years, and if 2008 comes again then 50%+ is not out of the question, and if there's a Great Depression then 80%+. If the world ends... then 100% ;-( .
Now that everyone is terrified from my musings... DYOR !
Ed,
I noticed today that the vigintile chart for >£350m shows the 95-100 group performing not only worse than the 90-95 group, but the 20-25 group too. In fact this chart is all over the place and does not follow the expected pattern of improving performace with higher rank. When I checked, there were about 22 stocks in the 95-100 vigintile, so the number is not so small as to indicate a problem due to sample size. I do wonder though if during the period the chart covers there were periods when the number in the group was very low This might have caused a very poorly performing stock to affect performance.
It would be good if you could dig into the data to find out what caused the above result - seeing the actual stocks and their performance would be ideal!
Thanks in advance.
22 is a very small sample and is going to be noisy.
Cig,
I have seen work showing that 15 is enough to track a market for a significant proportion of iterations. The problem is though, that if the average result of the particular stock universe you are looking at is skewed by a small number of high performers then you may well fall short if you do not invest in everything.
We have to remember that the >£350m 90-100 decile follows the expected pattern, but taking all the shares in the top half of that decile gives a different result altogether. The other point to note is that I am looking at a line which has been rebalanced every 6 months for the last 3 years, so this is not the result of just one sampling period. In any event, what we need to see is the data so we can understand what is going on, and also check that there is not an error in the graph calculation.
I remember that when What Works on Wall Street came out the best results actually came from PS ratio <1 and highest I year price increase. A subsequent edition showed more data which indicated the outperformance over 50 years was in large part due to PS ratio < 0.17 (and the high 1 year price increase). I have no doubt that included in the last set were a reasonable number of outright losses, but a lot of very high gainers. WWOWS used I think a sample of 50.
I know that in the US500 the movements over the last few months show the reverse of what one would expect because many of the "dogs" have been subject to short covering and hence have risen more than the value stocks.
Regards
Funnymoney - yes you are right. There are only 2 or 3 stocks in the 20-25 vigintile in some of those periods for £350m+ stocks... so I wouldn't read too much into it.
By contrast, there are maybe 30 odd in the 90-95 vigintile (>£350m).
The low ranking sets get very thin when you apply large cap filters as large caps tend to be better quality stocks.
These charts are noisy and need interpreted with a bit of judgement - one has to compare like with like and recognise when the sets are highly different.
I will look forward to seeing the European Naps and comparing to my own current list!
Re volatility, a tool that could compute portfolio volatility as wells as stock volatility would be great; dare I also request negative-only moves (Sortino Ratio). There are some very volatile stocks scoring in the high 90's on QVM. Saying at 31/12/16 that my portfolio selection made +X% tells me nothing about the risk I was exposed to .....
Hi Ed, If both Games Workshop and Character Group had dropped significantly today, I would argue it was due to a better NAPs process, because the new rule has reduced the exposure of the NAPs portfolio to the "Leisure Products" industry group. As it was just Games Workshop that dropped significantly, I suggest it was due to luck and randomness!
Well my changed approach this year has already helped to dodge one bullet. Games Workshop down 10% today !
We already have Character Group in the "Leisure Products" industry group, so GAW was skipped due to the new rule. The original NAPS process would have selected it.
Luck and randomness ? Or a better process ? I still have no idea, but watching closely.
Yes but under old rules you would have had Treatt (LON:TET) instead of J Sainsbury (LON:SBRY).?
A 10% drop in the value of one share in a 20 share portfolio is only 0.5% of the overall portfolio value so of little consequence. However, if you held Games Workshop in your personal portfolio would you have sold? Does the profit warning negate the high stockrank? Or does the fall in price present a buying opportunity?
To be honest I've no idea. In spite of the fall, the shares are still well up on a year ago, with strong relative strength and the StockRank is still high. Volatility is the nature of the game in small caps.
I respect Richard Beddard of Interactive Investor hugely. He's long followed GAW and I recommend his archive for those who want to do more research - http://www.iii.co.uk/news-opinion/blogs/share-sleu... He's not commented on the latest news, but am sure he will at some point.
Great article.
As a Euro-based investor I have applied some of the Naps approaches to the all-Europe stocks database - but these high-score a disproportionate number of Eastern European and Turkish shares. A geographical filter would be useful.
In the StockReports and screens volatility statistics and Sharpe ratios for various time periods would help filter some of the more volatile stocks. Assessing risk remains somewhat subjective .....
Hi gormanpd,
You can filter on exchanges, choosing either to include or exclude.
I hope that helps
Phil
Gormanpd - yeah these are good points. We'll be launching better geographic filtering tools in the next month.
I've got a European set of naps... it's mostly western europe - will probably publish next week.
Re - risk / volatility - yep I hear you... that's coming this year too.
I have a £270,000 portfolio, which I have built over the last 4 years. I've had a defensive mind set and have held mostly big cap stocks ,reinvesting the dividends. Overall, my portfolio is growing, but in the last 12 months I've suffered significant falls on GSK BP Shell Centrica RR,etc. My experience with Stockopedia has been to make me even more conservative. Piotroski and Altman scores seem to inhibit any trader tendencies I might have.
This year I'm going to try to follow SRs more closely which means that new money will go into the portfolio and will cherry pick from the Naps. Overall, I am very pleased with the level of analysis that Stockopedia provides. In a very uncertain world it consistently aids my decision making .
Ssen15
Hi grumpy5 (love the handle!).
For starters, if you look under Ranks and then say, the QVM screen and check on "best to worst" and then tick "worst" this will show the bottom 100 QVM stocks ascending from zero upwards. You can then select individual industry sectors etc., that interest you. Not sure if there is a movers and departers equivalent for low ranked stocks.
Gus.
Ed, an easy first step to aiding shorters would be to have a table of lowest stock ranks (and recent entrants and departers) to match that of highest. If there is one, I can't seem to find it.
Though using the stockrank numbers in my investing decisions for some time and though having followed your NAPS portfolio, what finally converted me was doing a 6 month back test on my own portfolio and comparing the outcomes of my ten highest ranked shares (6 months ago) with the performance of the ten lowest ranked shares. The results were a gain of 23% compared to a loss of 17% in the folowwing six months.
So I have re-jigged my portfolio along the lines of your NAPS and come up with many of the shares you have chosen. But I have also used some of my own sieves to eliminate one or two shares, ie Sainsbury, whose FCF never covers the dividend and is usually negative.
What I am also considering is using a 20% trailing stop loss, in order to minimize the loss on any really bad picks.
Thank you for being so open on your methods and also for your insights on luck and skill. I would be interested to hear your views on using a stop loss.
I have recently adopted a NAPS portfolio system also and have some confidence in it despite 2016 to date that has produced not surprisingly an overall loss. I have contained the losses by use of stop loss orders individual to each holding . My policy is also to replace the stopped out investments by reference to the current high stockrank issues within their sector even where this might involve a repurchase of the stopped out stock. Do you share this approach and has Ed Croft indicated his policy on stop losses.
I don't think stop losses will work due to the current market votality. im not going to use them just yet else you prob end up selling most things if the downward trends continue
I don't think Ed does use them, its not really the plan, its buy 20 stocks and see how they perform overall, if you keep selling all the time how are you going to judge the performance. Also your costs will be much higher. Studies have shown stop losses lose you money. In this market I think will be selling many if you use 150 day MA.
The investment in effort by Ed and the full Ranks and NAPS approach is impressive. The gains shown far outweighs my mediocre efforts from previous years, and has been sufficient for me to commit real money (40k) to it. However, I did not follow Ed's approach completely as I have made some (small) variations, which IMHO would reduce risk of downside. I may or may not be correct with this, but it helps me to sleep at night. I am also aware that being slightly more defensive may also reduce my chance of upside a little? We shall see.
I also will most probably follow a re-balancing approach which I think is as per Ed's approach, albeit that once again, it is most probably somewhat different.
Anyway, I am happy. For years I have tried to select and pick stocks. I spent a lot of time doing this, and TBH, I had years of outstanding success, followed by years of inept failure. My returns were not good enough. The logic behind this strategy, for me, is clear, and permits me to retain an interest in the stock market, whilst trying to maintain my day job (I am self employed, so limited time).
Thanks Ed. When looking at the NAPS list, unsurprisingly, many are similar, but we do have some differences. Fingers crossed for a successful year.
TT
I've got to say I've really been impressed with Stockopedia as I tested it out over 2015. Its fundamental filtering tools save me bundles of time. I'm a professional commodities / FX trader and technical analyst (This yr I will be helping to teach the Society of Technical Analysts MSTA course in London) and trader trainer (www.thestophunter.co.uk). To test Stockopedia further, I built a long/short equity trading strategy around the fundamentals - which I filtered using Stockopedia and added it to my Technical Analysis filters trading US and UK stocks. I traded this strategy from July to end Sept and returned 56% in no more than 3 months! So thanks Ed for the tool and how about building a short only strategy for those of us who can trade in that direction as well for 2016 and see how that does? Stephen
I just invested £34k following Eds naps rules. In Ed we trust :)
PhilH wrote:
"For example, mid way through the year I might decide to make an outrageous cash bid for the largest holding in one NAPS portfolio, thereby skewing the results of that portfolio. Does that mean that the rules are better or was there some freakish event? Whilst my suggestion is plainly ridiculous there are potentially other lucky/unlucky events that might occur that effect results, e.g. key CEO of a family run business getting killed."
Actually, that's not a ridiculous suggestion at all. If Quindell had been in a NAPS portfolio last year (not that it would have been) there was a takeover of its legal services division by the Australian firm Slater and Gordon at a crazily inflated price. That probably saved Quindell from going bust and led eventually to a big fall in Slater and Gordon's share price.
Fascinating article Ed and as ever really interesting to hear about the academic side. I'm a novice investor and am keen on stop losses and trailing stop losses. But, just wonder if you would use them with a NAPS approach. Normally I set the stop loss down say 10-15% from current price and if the price dips I take a small loss and hopefully buy back later or walk away if there is good reason but maybe with a NAPS approach it is best to loosen up on this a bit and only sell if the SR drops to say below 75? I know that there is a lot out there on stop losses but good to hear views on how they could be used with SR, if at all?
I must say that I am much more interested in an investing philosophy that evolves with learning and would never be very impressed by any single formula that was supposed to hold for all seasons. You could even make a strong case for a semi-annual re-appraisal, the way the world changes these days.
@jjis - Yes transaction costs weren't modelled, but then neither were dividends. There's at least a 2.7% yield on the original Naps and the average spread was 2%. So it would have evened out.
@frop @gus1065 @herbie - here here !
Blimey Ed can't win.
Publish several variants and he's accused of covering his arse, publish one and he's changing the playing field.
If you wan't a NAPS list based on last years criteria, can I suggest ... you do it yourself! It's hardly complex!
QuaysideCapital ... your analogy is not comparable because developers test changing software with the same test data. The test data for 2016 NAPS is not the same as 2015 NAPS.
If you take the rules for the 2015 NAPS and 2016 NAPS and apply them both to 2016 data, then you're using the same test data for both, so it is comparable.
You seem to be attributing the relative success or failure of the either set to the rules as opposed to some other factors.
For example, mid way through the year I might decide to make an outrageous cash bid for the largest holding in one NAPS portfolio, thereby skewing the results of that portfolio. Does that mean that the rules are better or was there some freakish event? Whilst my suggestion is plainly ridiculous there are potentially other lucky/unlucky events that might occur that effect results, e.g. key CEO of a family run business getting killed.
If a pair of NAPS portfolios were constructed every monday throughout 2016 and the 52 portfolios were tracked then maybe rolling forwards then you'd be able to draw some more meaningful conclusions.
Anyone who saw the varied performance of randomised portfolios that Ed posted some time ago will realise that there can be significant variations in performance.
Enjoy
Phil
Alright, taking into account the example you outlined that's a fair argument - you couldn't compare the two approaches in that context because of freakish share price incidents - I completely agree.
But let's go more scientific with it. Take out the outliers (1), and which approach comes out on top in a given year? Freakish values are omitted in scientific data sets as anomalies, why not in financial data? This approach eliminates the extremes of the luck (good or bad) element from your analysis. Then you can be more objective about the relative merits of your approaches.
That said, filtering out those anomalies could just get rid of some damn good stock picks (e.g. Character). In that situation you have to make a judgement for yourself about where blind luck has played its part.
I'm not meaning to be a pain with this, I'm playing devils advocate. How does one compare and contrast different methods of stock picking in the most objective manner? Don't get me wrong, I appreciate there's only so far you can go (as Ed rightly pointed out) until it does become a subjective matter since everyone is different and has different risk appetites. My academic background is Physics so I'm trying to boil this down to where the one hits the border between the science and the practically of the scenario.
(1) of course you have to agree this - how far out of the mean is an outlier? How long is a piece of string?
Ed is certainly better placed than me to explain how statistical analysis is performed in financial research.
In terms of comparing investment approaches I was reading about the Sharpe ratio which can used to evaluate and compare the risk-adjusted performance of a fund/portfolio.
It might well be interesting to track the Sharpe ratio for the NAPS portfolio too & the Guru strategies.
I calculated my Sharpe ratio for the last three years (since I switched to Stockopedia) and was amazed to find it was 3.25 for an annualised return of close to 26%.
The higher the Sharpe ratio the less risk associated with the return. So if you wanted a return of 26% you could compare the Sharpe ratios of various products or investments styles that typically delivered 26% in order to determine which incurred less risk.
QuaysideCapital - as PhilH has rightly pointed out all we're doing is creating samples from the high StockRank population.
If you are a physicist you may understand population sampling. The overall population of high StockRank shares has had a decent hit rate and performance in the last few years. So if we had chosen almost any random sample with enough stocks in it, we should have been able to generate a return that was representative of the overall population. I've covered random portfolio generation before - see this post - http://www.stockopedia.com/content/how-many-stocks...
I think it's fair to say that 25 stocks has been about the right number of stocks for a random portfolio to end up with a return that hugged the 90+ StockRank benchmark closely. But the annual standard deviation of results even at 25 stocks is still quite wide.
From those charts, there's probably a 10% standard deviation at 25 stocks. Given the overall StockRank 90+ population managed a 22% return last year... the 2015 Naps probably were 2 standard deviations of return above the benchmark. That's an outlier result - probably beating 95% of random StockRank portfolios. We got very lucky ! I can't pretend that it was my skill that generated the excess return - so it can't be called 'alpha' - I was just trying to get the basics right and harvest available market rewards.
Thinking statistically we have to realise that we can't over-optimise or find the perfect strategy with the tools we have at hand - there's a lot of luck and randomness involved. What's most important is to try to get the basics right and manage the worst of the risks.
Maybe this year the markets will tank and these 2016 Naps will be 2 standard deviations below the benchmark. That would be a nasty result but not beyond the realms of possibility. And in answer to someone else's question... that's why hedging and/or stop losses can be such a good idea ! But that's another blog.
Ok, with the statistics there I see what you're getting at. Fair point and thanks for the explanation. As always, a lot of appreciation for the work you and the Stockopedia team are doing here Ed - it's all really helpful stuff. Cheers
RT
It would take about 10 minutes to set up a Naps portfolio using the 2015 selection criteria as these were, I believe, pretty mechanical and consciously set up to take out objective thought and decision making. If you look through Ed's Naps 2015 discussion threads I recall these parameters were quite explicitly set out. Screen the stocks for max spread (500bps) and minimum market cap(£20m). Run a QVM screen and pick the top 2 stocks in each industry sector based on Maximum Stock Ranking. "Buy" each stock into a sample portfolio in an amount of say, £2,000 per stock with assumed costs of say £10 per trade plus stamp duty if main LSE listed and mark to market from bid to offer.
Personally, I like the thinking behind the 2016 Naps; we all "learn by doing" and surely it's a good thing to identify how things can be done more effectively (in this case with a lower risk approach) and try to improve the previous methodology. It is after all, still essentially the same Stock Ranking based approach but with a bit more subjective input and learned wisdom from possible issues identified the last time around. An evolution rather than a revolution.
Gus.
If you keep changing the parameters each year, then what are readers supposed to take from the exercise?
I get that you are nervous and feel the same selection criteria will do worse this year, and you want to increase the chances of a better return (or a less bad one) after an incredible year, but I thought the idea was that you were going to use the same criteria which was a hands off, no thought portfolio.
Intuitively I would have done the same as you have, but that's not the point...is it?
This is a genuine question Ed.
NI
I think the point is Ed + Stockopedia in general, are providing a real time demonstration of their own thoughts on investing (based on academic research) and showing the evolution of their implementation of this. I don't really think Ed has any duty to rinse and repeat previous years rules, in fact i'm astonished at the level of details and honesty he provides in these posts, putting himself out there for all to see and judge. Most other professionals refine "their system" and then only publish when its a proven success! Quietly dropping or forgetting what doesn't work!
Year on year they are reviewing this process, identifying what they can improve upon (in their mind) and acting accordingly. These rules changes are clearly spelt out in the above post as Ed's attempt to further manage and reduce risk, possibly sacrificing superior returns for a more comfortable level of risk and diversification to average out returns.
Why shouldn't the Stockranks approach, which is only a couple (?) of years old, not be subject to reflection on previous years and identify what additional measures can be taken to mitigate risk. They have never claimed the SR is perfect, just statistcally better probability of above average returns.
I think what we as readers can take from it is that there is no "perfect" system, any belief there is is deluding ourselves.
Ed himself has gone to great lengths to caveat past and future performance and why he has set the NAPS up in the first place. As readers if we want to run our own naps based on last years rules then thats very easy to do to check ongoing performance of the original criteria.
I see these rules tweaks as the logical evolution how to implement stock ranks into a portfolio, learning what quirks occur because of how the SR's group the market. Perhaps at the end of this year it will be decided that such rules were detrimental and overruled the original ethos of SR's but only testing this will do so.
Hi Ed,
As always a very interesting read - I've been trying to convince my dad about the merits of a more scientific, objective approach to investing and your articles seem to be slowly winning him over (if only I could be so convincing myself).
Anyway, I have one key question about this - are you planning on having another set of 2016 NAPS but using the 2015 rules?
If not, how can you be sure that the change you would see year-to-year would be down to your change in approach and not just the way the market has moved in different 52-week periods?
The way I see it, you can only compare approaches with like-for-like market conditions, something you wouldn't get if you looked at the 2015 NAPS against the 2016.
RT
No - I'm committed to publishing 1 portfolio. 1 portfolio matters, multiple portfolios is hedging bets. We may though publish European and US comparables, but no more than 1 NAPS in each region.
I'm sure I'll blog on the difference between the approaches later in the year. If the market crashes maybe I'll have been wise to vacate the sub £50m region. If it doesn't maybe I won't have been.
Why would we compare the 2015 NAPS versus the 2016 NAPS? 2015 is gone. 2016 is now. Life is full of uncertainty and change. I am certain that my new rules would have done worse last year. I'm certain that this year's results will be very different.
I ask the question as, given that you're changing the selection criteria as well as using a new 52-week period of market data, you've got 2 variables that are changing. How are you supposed to know which has had the effect in this situation?
If for example, you use the same approach from 2015 to 2016 (and presumably continue on year after year) with consistently high returns, you know the approach is sound.
If on the other hand, you use different approaches but on the same set of market data (i.e. the same year) you can distinguish the differing positive and negative effects of each strategy/approach from one another.
As a developer, how would you go about diagnosing the cause of software bugs. Do you change a load of parameters at the same time and hope something (of many things) you've done has fixed the issue? Or do you change one by one so you're able to diagnose the root cause of the issue?
Maybe I'm going way into the detail, but trying to take a more scientific approach to stock picking without employing a fundamental principle of scientific method seems to be leaving something out in my mind.
I suggest you set up your own NAPS under the folios that is if you are a subscriber to Stockopedia then you can track it all the time, I have set up Ed's 2016 Naps.
A fair suggestion certainly. I'm merely interested as to how one approach performs against the other in the same year. That way one can effectively weed out which is the better strategy with a like-for-like data set.
Yes I think many also do. Thats why if you set up different sorts of selections you can see which works best, however every year is different so not sure how much can be gauged from past performance. Im not doing a NAPS myself, as I don't think the time is right to invest a large amount in the markets at the moment, I have picked up a few that appear on the NAPS though and sold off some that did not perform well last year and taken some profits on some of the high flyers. I'm also going a bit more defensive, buying larger caps. The dummy Naps I did in June 2015 is only up 1.5% which is sharp contrast with ones that were done about 1 year ago or more.
I wholeheartedly agree with you on the timing front. I was thinking purely on a virtual portfolio basis to be honest - more of an extended experiment than anything else. Then dependent on outcome, I may commit more to the concept.
QuaysideCapital wrote: "I'm merely interested as to how one approach performs against the other in the same year. That way one can effectively weed out which is the better strategy with a like-for-like data set."
I can see why you're interested in performing such an experiment. The problem is that doing a like-for-like comparison of two 20-stock NAP portfolios constructed using different rules in the same year would not give you any statistically meaningful results. The sample size and evaluation period of the experiment would be far too small, bearing in mind the huge variability in returns from individual stocks. Or to put it another way, the element of luck in the outcomes of the experiment would be far too large to be able to draw any sensible conclusions.
Well that's really part of the overall question I suppose. It boils down to, "is the whole system (of stocks and shares) just a little bit too complex to apply that kind of approach and get out something that can be compared on a level playing field?" And I think quite honestly you've hit the nail on the head so fair play.
Well my definition of High Flyer is based on its high QM Rank (91) and a low Value Rank. It's basically an expensive stock that has high growth and profitability. It's been in a consolidation phase. The P/E should fall if the growth comes through.
http://www.stockopedia.com/content/high-flyers-how-to-beat-the-market-in-expensive-and-highly-priced-shares-109584/
Anyway - this is all semantics to me.
Thanks I see. It seems quite an interesting share, I read your post in Jan 2014, it seems to have a history over last 2 years of share price shooting up 20% and then drifting back down. I see Paul does not like the balance sheet. For me I think as its just gone up 20% I will leave for now.
I think what's interesting about the stocks that fall out of the above selection process is how their style profiles vary considerably.
There are some serious "Contrarian" plays like Drax which have had poor momentum, but there are also some high growth "High Flyers" like Alternative Networks in the mix.
Many screening processes end up with stocks that have identical profiles. e.g. many people screen for stocks at new highs. While this is a proven strategy, it does leave the entire portfolio exposed to momentum reversals, which can be quite nasty at times.
The NAPS portfolio approach generates a diversified list not only across sectors and size, but also across styles. Styles come in and out of fashion - Value investing can work really well at times, Dividend investing at others, Momentum/Growth investing at others. A diversified style approach ought to be more robust to all types of markets.
Anyway, that's the theory, and that's why I prefer using stock ranks over stock screens.
Whether it works or not is another matter. But that's what we'll be finding out.
Edward, Alternative Networks (LON:AN.) does not look like a high flyer? Certainly not share price, in fact its in death cross on 50/200 MA. Character (LON:CCT) and Inland Homes (LON:INL) I would say are high flyers although Character (LON:CCT) has lost momentum recently.
Hi Ed thanks for the updated Naps. In the article you mentioned that you had set up an An example NAPS stock screen but the link just goes to last years article - I wonder did you still have a link for that.
The other observation is that on paper like this you can just start a whole new list, whereas in a real portfolio you'd have to turnover a large % to get to your new portfolio with all the inherent costs, but with 40%+ gains in the bank I guess that wouldn't hurt so much.
Great article.
I wonder what effect reversing the market cap criteria would have. So, instead of setting a floor for capitalisation to omit micro caps setting a ceiling so that only micro caps were included.
This would be to me at least only of academic interest because it wouldn't fit my risk appetite. Might still be interesting though?!
Why not set it up under a Folio then you can check? I have 5 different Naps on the go at the moment.
Hi Edward, How did the SNAPS do?
Snaps did 32% over the year. They were up strongly on the rebalance, but didn't do as well as the Naps. The Naps and Snaps now literally Snap again so I didn't want to labour the point in the article... I'll revisit them in June.
OK Thanks.
Great article and a nice carry on from Naps 2015!
By getting a circa 40 percent return in Yr 1 has huge implications, as you could now get much lower returns in future years and still manage a great average rate of return.
I think the challenge will come on how to rebalance the portfolio, when, how...
Ed, you have commented before that your personal portfolio also uses other investment instruments, which would imply...for you....the Naps portfolio...isn't 100 percent suited to your investment style.
But that is the great thing, we can all assess what levels of risk we are willing to take and act accordingly..
It would be great to jump into a time machine and pop to the end of 2016 for an annual review!
Happy New Year!
Ed,
Have you modelled the effects of seasonality along with a random high SR portfolio
(i.e.invest 100% Nov 1, 100% cash May1, 100% invest Nov 1...)
Just been looking at my NAPS I did last year, I picked 20 shares similar rules to Ed's original NAPS. The one I did in December is already as high as the June one. June has only gone up 3%. Actually even though the markets have been down this year the NAPS have done well.
I was looking into Hilton Food (LON:HFG) not I company I know much about and I just don't get why the high ranking and the increase in share price, margins are very low about 2%, EPS is flat or negative, same for sales. Graham F. -39 Yes the EPS for 2016 is +23% not sure where this comes from and how reliable it is, note 2015 results have not been released yet. So what am I missing? Is all based the future EPS?
Hi,
Thanks Ed for the 2016 Naps portfolio.
I guess performance of the modified rules will become clear in 12 months time.
I decided to invest in my 2016 Naps using the original rules ..about half the portfolio overlaps with the new rules based you published above.
Thanks for the added value to the service, makes it worthwhile.
Mike ,
Ed,
Excellent article, especially coming a few days after Gundroo's piece on his own success.
With all the usual caveats, not the least of which is it's all about time in the market, not timing the market, would you share your thoughts on the widely predicted imminent crash, using your process/luck matrix?
Two queries:
1. Can you provide the screen for Europe & US, for those of us subscribing to and investing in those markets?
2. Using the algorithms, how far can you backtest, to show how the 2015 and 2016 NAPS would have performed in other market conditions.
Best wishes.
AK
As long as I've been investing there's always a crash around the corner. I've learnt not to trust the averages nor the pundits. I was paranoid last January, and the year proved very fruitful. If I'd listened to my instincts I'd have stayed on the sidelines.
I'm always as concerned as anyone. The US stock market is clearly overvalued. It's been struggling to make new highs after a stonking 6 year bull run. Sure, if the US has a wobble, all markets will have a wobble, but volatility is par for the course in equities - taking on equity risk is why we get paid.
The best advice I've heard is to 'sell to the sleeping point' - but how you do that selling is the important thing. I never sell outright any more as I never get back in at the right time. I sell short instead (to hedge). It's so much easier to unwind a short than to buy back in.
"Sell down to your sleeping point" is my favourite Jesse Livermore quote, although he claims to be quoting someone else.
Hi Ed -
Looking back over 2015, I 've had a similar problem. I am kind of hardwired to sell as soon as a stock has gone over approx 25% gain. The itch gets worse when the gain reaches 40%. The result is that I have left a lot of money on the table by folding my cards. ( 2 multi-baggers in 2015)
Think I will try your approach of short selling for the reasons you state.
The diversification rules state "No more than 1 from each industry group - to minimise single industry risk." but you have included Indivior and GSK. Do you feel they are sufficiently different to ignore this rule?
David - that's a good observation, and does need clarified. I should have done so in the article.
Actually my original rules were StockRank > 80. But with this rule I ended up with only 1 Healthcare stock and short a large cap... that left me in a conundrum... which of my rules should I break ?
I chose the third option and dropped the cutoff to 75. But I could only find 1 large cap that qualified and it was in the same industry group. So I had to break the industry group rule to finish the portfolio.
I notice today that UDG Healthcare would have made the cut in a different industry group. So there's a new option above 75 today.
It should be noted that Healthcare isn't the only sector with 2 from the same industry group. Telecoms only has a single industry group to choose from. So we do have 2 Telecom stocks and 2 Pharmaceutical stocks.
Enjoyed the article but have a comment about the use of sectors, Ed. The logic of spreading across these is to diversify, which I agree with totally. The problem is that some companies activities go across sectors and although I'm not suggesting any sectors are wrong, some are a little debatable. Energy stocks were hammered last year as you mention for instance. NWF did well but is that because it bucked the trend or is it because it's interests are not really in the energy sector? I guess what I'm trying to get at is that your diversified set might not be quite as diversified as you might hope for. As for your inclusion of FTSE 100 companies, I'm pleased to see that you have picked almost all the ones I have chosen, although my rationale was more focused on yield, which NG, GSK and SBRY give you. Are these significant dividends built into your year's performance figures as a matter of interest?
Hi Ed
Great thought provoking article once again.
At the turn of the year I made my own 20 share portfolio. I don’t go for as much diversification but my SR average will be a bit higher than yours.
My choices were:-
Industrials
Dart 99,DWHA 98,EMR 98,SPRP 96, ZYT 96, WIZZ 99
Financials
HAT 99, FRP 97
Consumer Cyclicals
CAMB 98, EPWN 97, PSN 97, GAW 99
Energy
NWF 99
Technology
CCC 98, UNG 98
Basic Material
IGR 98, RBN 97
Telecoms
MANX 95
Healthcare
ANCR 96
Consumer Defensives
TET 96
So diversification is in 9 Sectors and 14 Sub-sectors.
Criteria were SR > 90, No or reducing Debt, Market Cap >20m.
Best
Joe
Herbie
I wouldn't read too much into the bid being rejected at this point in time. The fact Sainsbur's are reporting on presumably cordial discussions held during 2015 that came to nothing in November only now suggests battle lines are being drawn and there may be a few more salvos fired.
Even at £140p, Home Retail (LON:HOME) is still potentially very cheap and today's news effectively puts it into play with PE looking at a break up and trade buyers maybe wanting some or all of the pieces. Today's spike may in part be due to the minimum 8.5% shorters closing out positions so it may well fall back short term, but I suspect there will be more activity in coming weeks and months. You would need to be pretty brave IMO to put on naked short at the moment.
All the best,
Gus
(Long £HOME).
Great article...an enjoyable read.
Talking of Drax, this out today vis their next Biomass CFD contract -
The European Commission (EC) has today announced that it has opened a formal (Phase 2) State aid investigation into the award of an Investment Contract(1) to Drax for its third coal-to-biomass unit conversion. This is the next step in the process for obtaining State aid approval and is in line with expectations.
http://www.investegate.co.uk/drax-group-plc/drx/drax-cfd-investment-contract/201601051144578685K/?fe=1&utm_source=FE%20Investegate%20Alerts&utm_medium=Email&utm_content=Announcement%20Alert%20Mail&utm_campaign=Drax%20Group%20Plc%20Alert
Drax Group Plc faces a European Union investigation into the U.K.’s plans to support converting a coal-powered plant to biomass generation after regulators said the aid may overcompensate Drax and the project could harm competition for wood pellets used by other energy producers."
The European Commission said its probe will focus on U.K. estimates for the plant’s economic performance, which it thinks "may be too conservative" and may allow the plant make more money than envisaged, undermining its need for government help.
http://www.bloomberg.com/news/articles/2016-01-05/drax-s-coal-to-biomass-u-k-conversion-aid-faces-eu-probe
Drax pointed out that the project would be its third coal-to-biomass conversion project and said the EC’s decision to investigate the scheme further is “in line with expectations”.
http://www.ft.com/fastft/2016/01/05/eu-opens-in-depth-probe-into-drax-biomass-plans/
Ed - That's an excellent article.
A couple of weeks ago, I used a similar but slightly simpler approach to create a portfolio of 20 UK stocks. Rather than selecting 2 stocks from each of 10 stock market sectors with no two stocks being in the same industry group, I just selected 20 stocks in order of reducing StockRank with the proviso that each stock must be from a different industry group. I think my approach produces a less diversified portfolio than yours, but on the other hand it produces a portfolio with a higher average StockRank than yours so the expected return from my portfolio is probably higher although there is likely to be greater uncertainty and variability in the return from my portfolio. This is another example of the trade-off between risk and expected return.
Ed,
How do you feel about your J Sainsbury (LON:SBRY) selection given today's news re Home Retail (LON:HOME). Does the 5% drop in share price increase or decrease your confidence in this particularly stock. Guess can now buy it cheaper than today but may raise longer term questions about strategic direction for J Sainsbury (LON:SBRY)
Regards
Andrew
the Consumer Defensive sector has been totally left out, interesting
Hilton Foods and Treatt are in that sector, yes there is a mistake in the article with Hilton being under telecoms.
vik2001 - no it's there... for some reason the sub-heading had been left out. Sainsbury's and Hilton Food Group are the defensives this year.
ACounsell - there's not much I can read into the news flow - certainly the 5% drop in SBRY isn't a great start. I'm just a dumb quant remember :-(
I read the bid has been rejected so maybe the share will bounce back tomorrow.
Hi Ed, excellent article. I think your caveats about the significance of luck in the 2015 selections is well made. This said, I suspect many of us would happily settle for even half the level of returns you achieved last year.
Also interested to see many of your Naps match my own (posted in a link on 15/12/15). I make it that we have 11 in common plus I have two of your also ran exclusions. My criteria are a little less risk averse in that I have not gone for as much diversification preferring to pick stronger Stock Rankings at the expense of being light in utilities and healthcare and to an extent technology, telecoms and energy. I think my monkey brain bias has also been to veer towards positive cyclical stocks which might come unstuck if the economy stalls. I also have more small caps. My full list is:-
Cambria Automobiles (LON:CAMB); Character (LON:CCT); Dart (LON:DTG); H & T (LON:HAT); Hydro International (LON:HYD); NWF (LON:NWF); Empresaria (LON:EMR); Inland Homes (LON:INL); Wizz Air Holdings (LON:WIZZ); Computacenter (LON:CCC); Headlam (LON:HEAD); Journey (LON:JNY); Somero Enterprises Inc (LON:SOM); Berkeley Group (LON:BKG); Mears (LON:MER); Novae (LON:NVA); Sprue Aegis (LON:SPRP); Fyffes (LON:FFY); Safestore Holdings (LON:SAFE); Castings (LON:CGS); Norcros (LON:NXR); Manx Telecom (LON:MANX); Telford Homes (LON:TEF); J Sainsbury (LON:SBRY); and, Finsbury Food (LON:FIF). - See more at: http://www.stockopedia.com/content/webinar-alert-using-the-stockranks-to-build-the-naps-portfolio-113085/?comment=76#76
So far, my Naps are up by about 3.8% after a month or so including costs and bid/offer spread of about 1.2%, even after yesterday's sell off so a reasonable start. Strong starts from Journey and Inland Homes (up 18 and 19% respectively) offset in part by Somero (down 6%). Sainsbury's was doing well but sold off after today's news re. Home Retail (LON:HOME). Since I'm also long Home Retail (LON:HOME) in my residual portfolio I'm not too disappointed
All the best,
Gus.
Ed,
Good article thanks. Would you take a different approach specifically with microcaps if say you were not measuring annual performance but rather looking at a longer timeframe without a set date for totalling up performance?
Reason I ask is that there are great businesses below £50m which have potential for outsized returns and short term liquidity is only an issue if you have to sell or in your case you have to measure performance at a set point in time, e.g year end.
In theory annual performance is irrelevant for a long term investor, more about the end game.
HI Ed
Couple of things. Your example NAPS stock screen appears to link through to the 2015 NAPS article, which may not be what you intended. And Hilton Food seems to have diversified into the Telco sector, which seems unlikely at first blush ...
Of course by moving away from smaller stocks you're reducing the possible impact of the small cap bias, it'll be interesting to see what the effect of that is.
Good luck!
timarr
Great article Ed.
Last year I was pleased to see Adept Telecom (LON:ADT) on your list. (I still hold), This year I am pleased to see Inland Homes (LON:INL)
I bought Inland in November having met the management and thought I would share my reasoning, which I posted at the time. I look forward to working my way through the list; a number are already on my watch list.
Inland Homes:
On 12th November I attended a post results meeting with Stephen Wicks, CEO and Nishith Malde FD. Both are co-founders of the business and hold substantial stakes; 8.0% and 5.6% respectively. Prior to founding Inland in 2005, Stephen Wicks was the founding shareholder and chief executive of Country & Metropolitan plc, which in December 1999 floated on the main market of the London Stock Exchange with a market capitalisation of £6.9 million. He directed the growth of Country & Metropolitan plc until its disposal in April 2005 to Gladedale Holdings plc for approximately £72 million. Nishith Malde and Paul Brett, (3.5% shareholder), Land Director were both members of that team.
Inland’s real expertise is in buying land pre-planning permission and then taking it through the planning process to a successful conclusion. It tends to take on complex situations which require the skills and expertise of Stephen Wicks and his team. The volume housebuilders either do not have these skills or are not interested in this part of the market until consent has been achieved. It then either sells on the land, normally to one of the large national house builders and/or develops the site itself; it’s about achieving a healthy balance and maximising returns. Last year for instance it developed and sold 248 private homes and sold 440 plots. The average price of its homes sold were £264,000 and it is based in the valuable South East ex-London market.
In the current year it says it will probably sell a similar number of homes before ramping up to around 500 per annum. He said housebuilding brings stable cash flow but the “core business will still be buying, developing and shifting land”. He also said “you can turn on/off housebuilding when you like!”
In total it had just over 5,176 plots at various stages of development at the 30th June year-end, up from 3,734 plots the year before.
A third leg to the business is rental income: last year it rented on assured short term tenancy agreements, 30 of the 76 houses it acquired when it purchased the Wilton Park (near Beaconsfield) site from the MOD. It intends to rent the remainder in the current year and hold them as investment assets; the annual income should exceed £1m. The latest results were flattered by a revaluation of this housing portfolio leading to a £ 14.5m uplift to profits. The CEO said his aim was to try and build rental income up to around £4m per annum, enough to cover annual overheads and give some comfort if/when we go into a down turn.
Wilton Park is described as the jewel in the crown; it cost £35m and as well as the 76 homes acquired is expected to see a further 300 homes together with commercial space. It expects to achieve planning permission by September next year and the I expect it will dispose of the development sometime after that; 2017 could be a bumper year for shareholders with it believing the value of the site is around £250m! Remember the purchase price was £35m. Once they get planning permission it could be a disposal but they will be looking to maximise returns to shareholders; there could be a special dividend.
So why have I bought a stake now? I think that there is scope for a substantial uplift in value over the next couple of years, the management is impressive, (they have done it before with Country and Metropolitan), they have substantial stakes in the business and I am sure will see it through to a successful conclusion i.e. a sale to a larger company. The valuation looks attractive to me given the scope for a substantial uplift in asset value. It is paying a final dividend a 0.7p per share, (making 1.0p for the year) on January 22nd giving it a dividend yield of 1.4% with the 67% increase demonstrating “the Group’s continued strong financial position and confidence in the medium-term outlook”. On Stockopedia it has a StockRank of 97 (Value 84, Quality 67 and Momentum 95) and it passes no fewer than 7 of the “guru Screens”.
John - I've thought of you every time I've seen Adept Telecom this year. Really glad it's worked out so well. It was one of those stocks that everyone was ignoring, and from memory most were negative on. I find time and again that it's the stocks where there's a disconnect between attention and opportunity that things work out the best.
Great show again Ed real intelligent insight, gets us mortals thinking as it should.
Hi Ed, thanks for putting the new NAPS portfolio together I learnt a lot following last years portfolio. My current aim is to put together a portfolio with 30 stocks - a large, mid and small cap from each sector using the rest of the NAPS rules. Would you advise against that for any reason in comparison to the 20 stock NAPS portfolio? I'm hoping that it would lead to a stable outcome and provide straightforward diversification across sectors and size.
Many thanks Ed, another good article!
I'm glad to see some of my holdings in there; CCT, HAT, MANX, but disappointed not to see my two healthcare holdings; ANCR, EMIS. I'll follow this years NAPS with interest and hope 2016 will be prosperous for us both.
Interesting selection. Re: Inland Homes (LON:INL) note 2015 results were delayed in order to include a large sale so the figures are somewhat distorted, thats why 2016 EPS forecast are well down, also the CEO has recently sold nearly 2m shares. A few have quite low SR scores?
Herbie, the StockRanks of the selections go as low as 78 for Glaxo.
That's what happens when you put in extensive portfolio constraints as I have. The sector, industry group and size constraints mean that many, many stocks with higher StockRanks are rejected.
The returns may be lower as a result, but with any luck the risk should be lessened. We shall see. It's all a live experiment.
There are good arguments for ignoring constraints and just picking the highest ranking shares in certain higher probability industry groups. I'm sure if someone wants to put some thought into it, they could create a StockRank portfolio that does far better just focusing on certain industry groups.
Lost my reply now.
Anyway yes I understand.
Would it be possible to select another NAPS on last years rules to compare?
Thanks Ed, this is a fantastic article. I plan to read through it a couple of times.