February 21, 2018
NOTE: This article has been modified to serve as a complement to the now published full length article (http://ezinearticles.com/?The-...). It provides the charts and table publishers could not publish.
That is right. If you thought the worst was over and you could return to business as usual with the stock market, think again. The spike in volatility alone should signal there has been a paradigm change. Regardless which popular metric you use; PE, Shiller’s CAPE Ratio, or Buffett’s Market to GDP comparison; this is still one of the most expensive markets of the past century. The other two were the 1929 and 2000 markets and we know how those turned out. And we still have a demographic scenario[1] that warrants a major market drop.
The question is when. Some folks are under the mistaken impression that stock market crashes occur at market tops. That is far from the truth. A study of major bear markets, those declining 28-plus –percent, since 1923, the year the precursor to the S&P 500 was introduced, reveals there is always a preamble to every major bear market. This is shown in the analysis below for each of the following major bear markets (28% decline or more): 2007, 2000, 1987, 1973, 1968, 1962, 1946, 1937, and 1929. Intraday prices and daily closes are only available for the S&P 500 from 1950 on. Therefore, Dow Jones Industrial Average closes were used for the markets before that.
2007
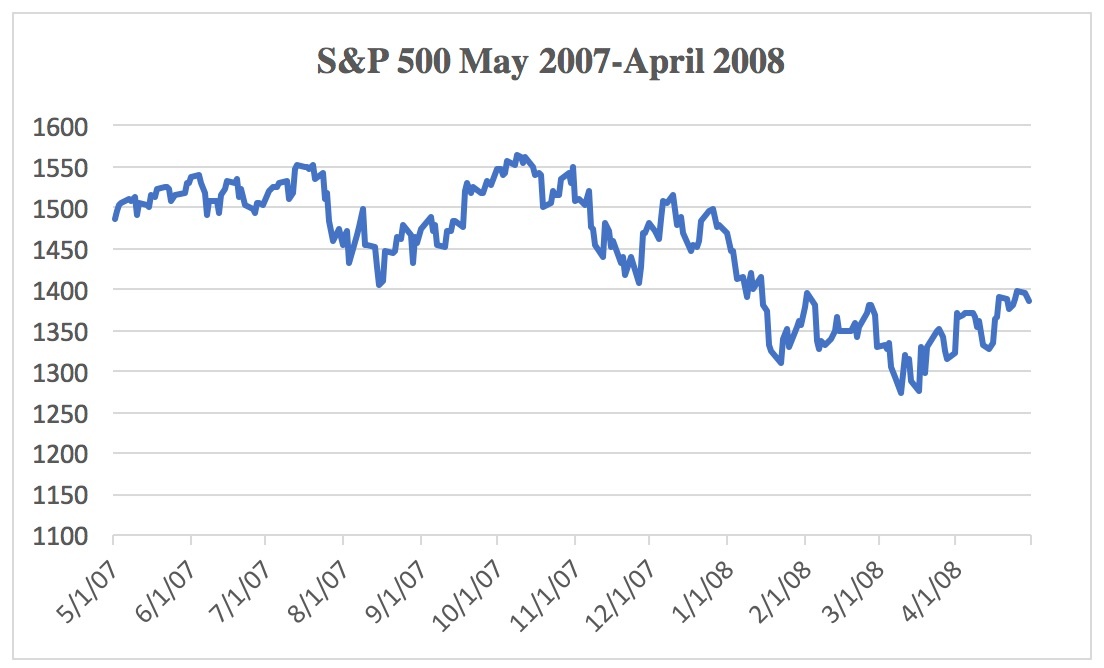
The initial top for the 2007 market came July 17 when the S&P 500 had an intraday high of 1555.90. After dropping 11.9% the market would climb again to a market top for the index of 1576,09 October 11, 2007 - 1.3% higher than its previous high. It would then drop to 666.79 March 9, 2009 for a 57.7% decline.
2000
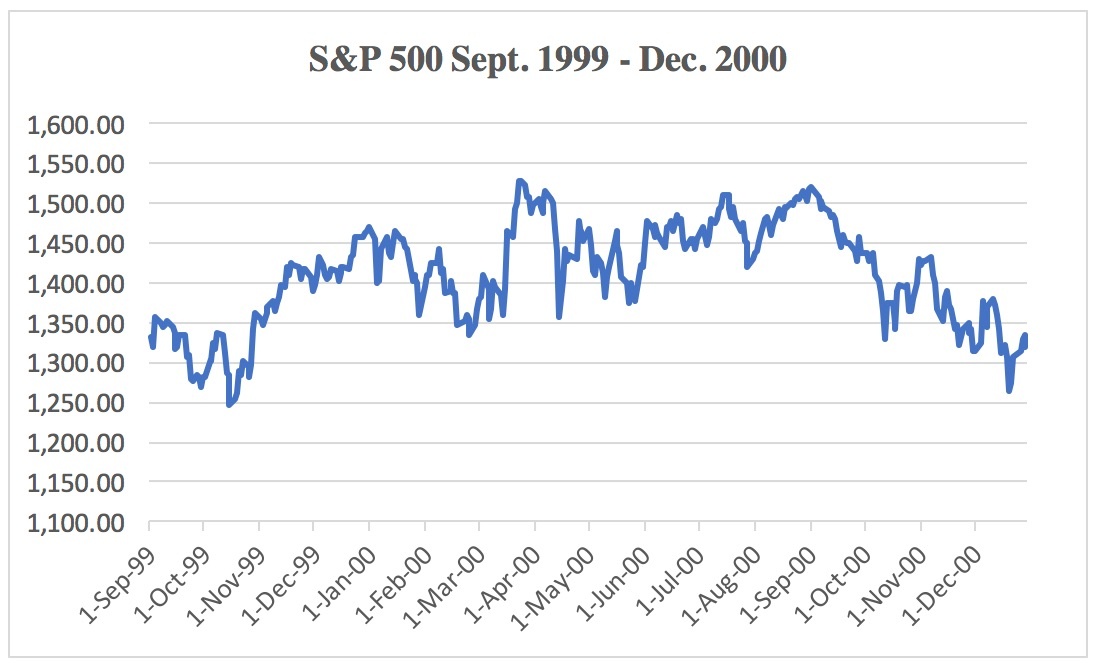
The market climaxed at 1552.87 March 24, 2000 for the S%P 500. It would drop precipitously April 14 to a low of 1339.40 – a 13.7% drop – but then slowly recovered to 1530.09 by September 1, 2000, only 1.5% below its all-time high. The market bottomed at 775.80 October 9, 2002 for a 50.1% decline.
1987
After hitting a high of 337.89 August 25, 1987, the S&P 500 dropped…