Pittards: From Value Trap to Contrarian Stock

Warren Buffett once suggested that investors should 'be fearful when others are greedy and greedy when others are fearful'. In practical terms, this could mean that investors should take a contrarian stance and buy scary stocks that no-one wants, while selling popular stocks that everyone loves. This is indeed the essence of contrarian investing.
Based on Stockopedia’s StockRank framework for classifying shares, the StockRank style of leather specialist Pittards’ has very recently changed to Contrarian. Stocks with this StockRank style are typically cheap, with strong fundamentals - for instance, a strong balance sheet and wide or improving profit margins. Contrarian plays also need investors to be sanguine about market sentiment, as these companies often have weak share price momentum.
In this piece we take a closer look at Pittards’ financial performance over recent years to discover why it has become a Contrarian stock, and explore what this means for its future prospects.
What does Pittards do?
Before looking at Pittards’ fundamentals, we should pause for a moment to understand exactly what the company does. Pittards is classified as a micro cap with a £12.4m market cap and just 1,648 employees. It designs and produces leather which is in turn used by other manufacturers to make a finished product - shoes, gloves and so on. For example, Slazenger incorporates Pittards’ leather into its cricket batting gloves. The shoe manufacturer New Balance also uses Pittards’ leather. The firm operates mainly in the UK, where it sources most of its hides, and in Ethiopia, where it sources the majority of its hairsheep skins.
Why Was Pittards a Value Trap?
We can see the evolution of Pittards’ StockRank style by looking at historical StockReports (see here). Pittards’ StockRank Style is now Contrarian, but back in May 2017, it was a Value Trap - and it was still a Value Trap in March 2018.
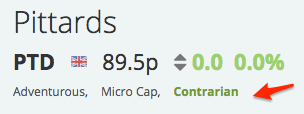
There is an important difference between Value Traps and Contrarian stocks. Contrarian stocks are typically cheap, but they could have strong and/or improving fundamentals, while remaining undervalued by the market. On the other hand, Value Traps may be cheap for a reason - perhaps they are in a weak financial position and are unlikely to recover.
Pittards is cheap, with a P/B ratio of 0.6 - well below the market median of 1.7. This time last year, it was already very cheap, with a P/B ratio of 0.56. A Stanford academic named Joseph Piotroski observed that the average low P/B firm is financially distressed. He noted: ‘This distress is associated with declining and/or persistently low margins, profits, cash flows and liquidity and rising and/or high levels of financial leverage.’
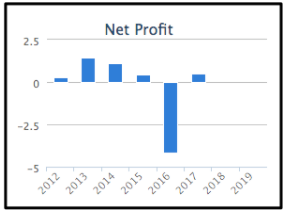
We can see from the chart above that Pittards has indeed been less profitable in recent years compared to 2013 and 2014. Why? In 2016, it clocked an ‘Unusual Expense’ of £4.31m. This expense relates to a write down of dress and sport glove leather, which resulted in a £1.27m loss in the UK and a £3.07m loss in Ethiopia.
When the value of inventory (in this case leather goods) falls, companies record this as a ‘write down’ expense on the income statement. Pittards recorded its 2016 write down against the backdrop of falling leather prices and weak consumer demand. The financial results noted that ‘the global leather market continues to be challenging for companies looking for growth against a backdrop of significant global change and weak consumer demand. Demand in our core markets of shoe, sport and dress gloves remains depressed’ (see here).
In essence then, Pittards had the characteristics of a Value Trap in May 2017. The firm had a very low P/B ratio. It had just reported its most unprofitable year since 2011, and there was no evidence that the company was about to bounce back. The Piotroski score - which gives a higher score to companies with improving fundamentals - was only 3 out of 9 (see here).
What has changed?
If Pittards has had a low P/B ratio over the last year or so, why then has it become a Contrarian stock? In a nutshell, there are signs that it could be making a financial recovery. The Piotroski F-Score is a useful metric which investors can use to ascertain whether a company is making a comeback. Let’s take a closer look...
The main difference between a Value Trap and a Contrarian stock is that a Value Trap will be cheap with weaker fundamentals, while a Contrarian stock will be cheap with stronger fundamentals. Although he never used the terms Value Trap or Contrarian stock, Joseph Piotroski developed a system that can be used to separate these types of investments.
Piotroski was aware that a portfolio of cheap, low P/B stocks tended to outperform expensive, high P/B stocks. But he noted that many cheap stocks were financially distressed and less than 44% of all low P/B stocks beat the market over a two year period. Piotroski found that 'the success of that [low P/B] strategy relies on the strong performance of a few firms'. Those cheap stocks which did outperform tended to be ‘financially strong’ with an improving financial position (such as wider profit margins) than previous years.
Piotroski identified 9 signals that could be used to identify stocks with improving fundamentals. According to his system, it would be a positive signal if the company was:
Making a profit;
Generating cash;
Making more cash than profits;
Making more profit than the previous year;
Reducing long term debt;
Increasing its ability to pay short term debts;
Operating without having to raise funds from shareholders;
Improving pricing power (in terms of gross profit margins);
Becoming more productive (in terms of asset turnover).
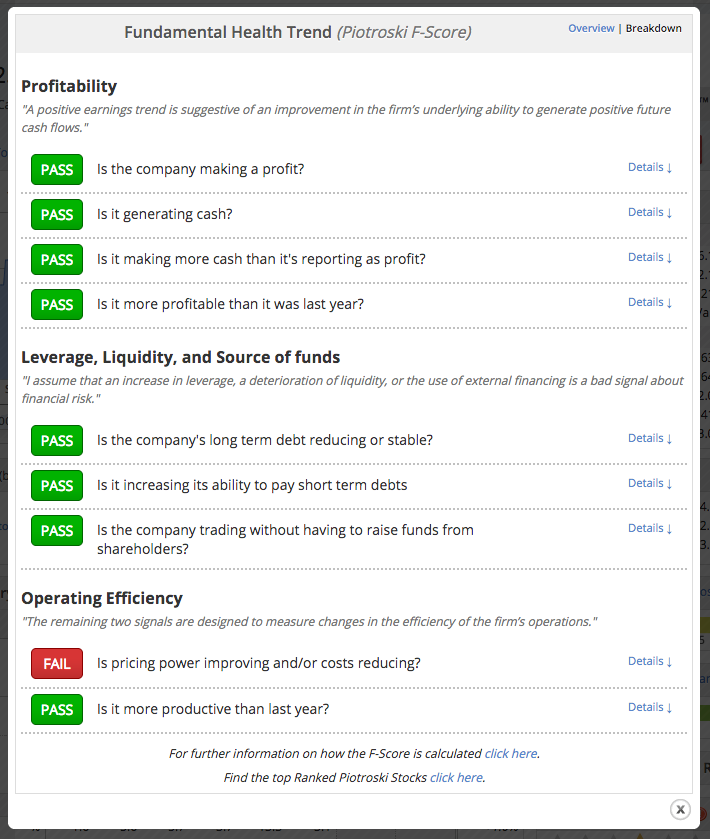
Interestingly, Pittards does have the characteristics of a company which may outperform according to Piotroski's system. There are potentially 9 bullish signals. Pittards has 8, as we can see from the image below. For example in 2017, Pittards generated £0.5m in net profits, compared to a £4.15m loss the previous year. So we would give the company a tick for signals 1 and 4 listed above.
Was 2017 a one off year, or does the rise in profits mark the beginning of a prolonged trend where profits keep growing? It is impossible to read the future. However, Pittards’ management seems bullish. The company’s most recent financial results (found here) outline that:
“One of our key financial measures is the Return on Capital Employed [ROCE]. This has increased in 2017 to 4.1% and our near term objective is to deliver returns above our estimated Weighted Average Cost of Capital of approximately 7%.”
The ROCE is calculated by dividing Operating Profits by Capital Employed (ie. Total Assets minus Current Liabilities). Since 2012, Pittards’ Capital Employed has ranged between £16.9m (2012) and £27.4m (2015) - see here.
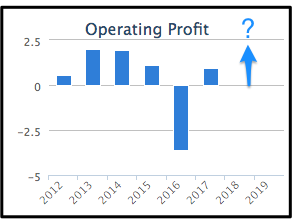
Let’s be conservative, and assume that the Capital Employed figure will be at the lower end of this range, around £17m over the next few years. A ROCE of 7% - in line with management objectives - would translate into an Operating Profit figure of around £1.19m (£17m x 0.07). This figure would be higher than any level since 2015. Back then, Pittards’ share price was around 40% higher than the current price.
Signs of positive earnings momentum
It is also interesting to note that brokers have recently started to pay more attention to Pittards. WH Ireland is the only broker to provide revenue and EPS estimates, but several months ago, no brokers covered the company. (You can see historical StockReports and broker coverage by following these steps). This could be a positive signal because - according to Piotroski - ‘analysts favour recommending stocks with strong recent performance’. On the other hand, low P/B stocks with a weak financial performance remain ‘neglected’ by brokers. They are ‘thinly covered by the analyst community and are plagued by low levels of investors interest’.
As we go forward, I will be looking out for signs that brokers are becoming more optimistic about Pittards’ future prospects. When brokers change their recommendation from for example ‘Sell’ to ‘Buy’, or increase their earnings forecasts, this can improve the company’s MomentumRank.
In turn, companies with a high Quality, Value and MomentumRank can elevate to the SuperStock category of stocks (see here). If this happens, Pittards would have made the complete transformation from Value Trap, to Contrarian play, through to SuperStock.
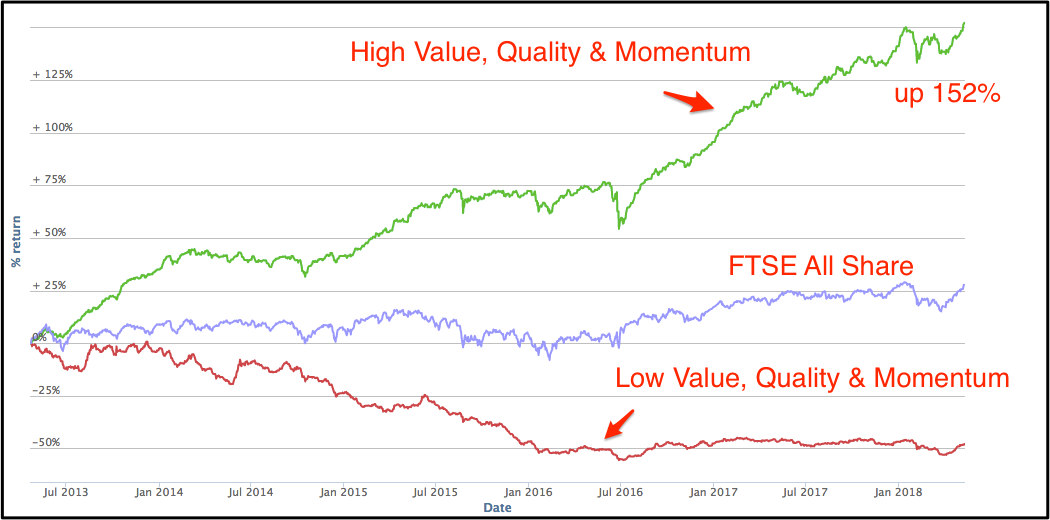
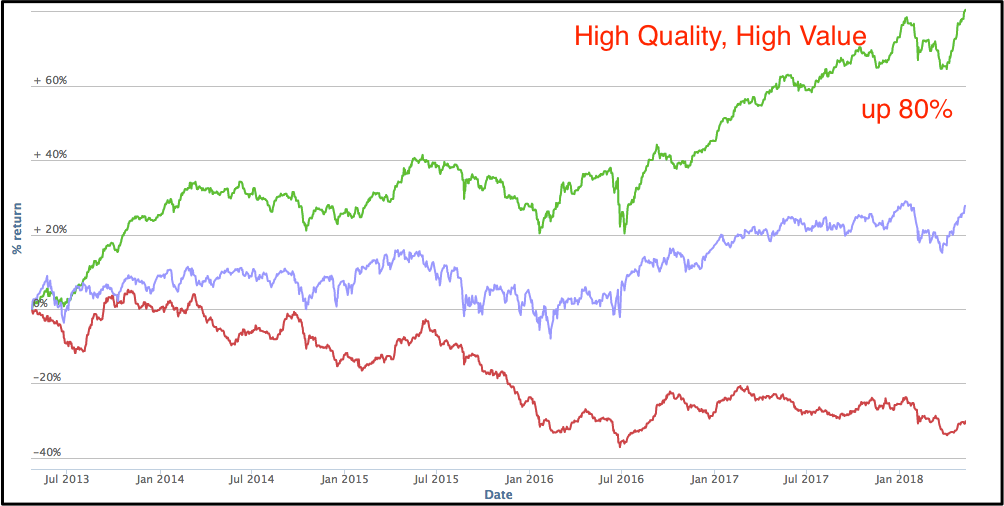
This would be a bullish signal because although companies with a high QV Rank (often Contrarian stocks) have historically outperformed the market, firms with a high QVM Rank (often SuperStocks) have in turn outperformed Contrarian stocks, as we can see from the charts below…
Practical steps to finding Contrarian stocks
StockReports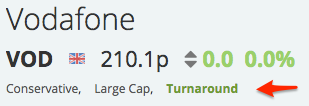 Investors can take several steps in order to find Contrarian stocks. We display the StockRank Style towards the top of each StockReport. For example, we can see from the image on the right that Vodafone is currently a ‘Turnaround’ (see here). We also display the Piotroski F-Score score on the StockReport (see here).
Stock Screener
Stockopedia’s Stock Screener enables investors to quickly find stocks that meet particular criteria. Investors can use the ‘Style / Risk / Size’ rule to hone in on Contrarian stocks. I’ve put a video together to illustrate how this can be done. You can watch the video here. Investors can also find stocks that meet Piotroski's investment criteria using the GuruScreens (see here).
The above tools are available to Stockopedia subscribers. You can take a free trial of our services here.
If you have any further questions about the StockRank styles, or Contrarian stocks in particular, please feel free to leave a comment below. We are also interested to hear your thoughts on Pittards. Is this stock still risky, or has the company truly transformed from a Value Trap to a Contrarian play?
Disclaimer
This is not financial advice. Our content is intended to be used and must be used for information and education purposes only. Please read our disclaimer and terms and conditions to understand our obligations.
8 comments
Can't escape the fact that Pittards management is pretty third rate.
Really good article, I like the articles that explain the transitions between Stockrank Styles so would welcome more of them.
Great article!
(I followed this company some years ago, but never bought)
The P/B ratio makes me think of Stanley Gibbons (£SGI).
They had stock on the books that was reportedly worth over 100m.
- until people realised that the value of the stock was SG's valuation and that if you actually disposed of even a small fraction, there is no way the full value would be realised.
In this case, the (P/S) / (P/B) ratio says they probably turn the stock over about once a year by value.
This indicates that the stock overhang has been cleared.
Pittards (LON:PTD) was covered be Simon Thompson at IC, but he pulled out in March '16.
The thing that put me off was that young people do not buy leather gloves, or bags - or posh leather shoes (within the mass market).
I have the feeling the whole 'leather goods' market is in gradual decline.
Pittards base their appeal on traditional techniques. This limits the opportunity for industrialisation.
... so no matter how good the ranks / metrics are I do not see great opportunities for growth or increasing margin.
As I have slowly dug deeper into how Stockopedia ranks stocks, I am getting better at reading the Stock reports and seeing whether the data tells a single story or conflicting stories. Alex's excellent article has triggered me to share what I now look at in a Stock Report to back up a QVM rank.
For Pittards (LON:PTD) the top-level QVM report looks like this:
Seemingly a high-Q high-V low-M stock.
But underneath that the report gives more info on the components which make up the QVM numbers.
The "Growth & Value" looks like this:
The key to reading this table is to look at the filled boxes on the right which give a visual indication of the "rank" for that metric in the industry and the market. The whole of Stocko seems to be built on the idea of ranking. If you convert all metrics into ranks then when you combine them (as Stocko does by averaging them together) you automatically align their median values (called "centering" in statistical circles) and you align the standard deviations (called "scaling"), as well as neutralising the effect of outliers.
So what we see is that the "Growth & Value" metrics all seem to agree that Pittards (LON:PTD) is on the expensive side.
But now look at the "Valuation box":
This box suggests that Pittards (LON:PTD) is cheap. The valuations not based on earnings see a different story and they also agree on their verdict.
The single Value Rank of 81 cannot capture that the story is not consistent across the metrics used to compute the Value Rank - but the Stock Report reveals the details. We also see that EV to EBITDA is right in the middle.
Moving on to Quality we get:
The quality is firmly near the middle (roughly Q=50 territory) but Stocko's ranking gives greater weight to the Piotroski F score so Q=75 because of the excellent F score of 8.
Digging a bit more deeply using my own screens, I got a score of 16/17 for financial strength and 15/27 for profitability. Looking at the breakdown of the F score in the main article seems to back that up.
The picture I see is of a financially strong company which is making an average ROCE.
What I don't particularly like is that the V picture is conflicted. Different measures give a different view as to whether the stock is cheap or expensive. Personally I prefer to see all the Value/Growth rankings near to the middle or a little either side.
But then I am definitely a factor investor. I am looking for stocks already possessing the factors I look for. Whereas clearly a Contrarian is specifically looking for hints that a stock will shortly change its spots before the rest of the market catches on.
Hi Nick,
Many thanks for reading the article and providing the feedback :- )
I guess I should point out that the PE ratio we display in the 'Growth & Value' box is based on forecast/future earnings, while the metrics we use to construct the ValueRank, including the PE are based on historical data. As such, all the metrics that underlie the ValueRank are calculated using historic earnings, historic book values and so on. Please see here for further details: http://bit.ly/2xc5XmN
You can see the metrics that underlie the ValueRank by following these steps:
1) Add a stock to a portfolio
2) Toggle to the value, quality or momentum tabs in the portfolio holdings page
3) Clicking on the cell which contains the respective Q, V or M-Rank
...please see this video: https://cl.ly/2P2W3J3p3221
We can see the breakdown of Pittards' ValueRank in the image below. The company has an expensive P/E ratio (even when we use historic data), an Earnings Yield in line with the market median, but is cheap in terms of P/B, P/S and P/FCF. Also note that the ValueRank is 81, so one might expect the company to be cheap across most metrics, but perhaps more expensive in other metrics. All metrics are constructed using historic data.
I'm happy to take further questions.
Thanks,
Alex
It would be really handy to be able to get that pop-up directly from the stock report without having to add the stock to a dummy portfolio first!
I think the main point I wanted to make was how useful those filled boxes actually are. I used to ignore them and just look at the numbers, but now I am a convert to the merits of rank-based assessments.
Nick you could try this work round if convenient.
From the stock reports you can click on either the industry or sector group at top of the page.
This takes you through to the ranks page for related sector/industry group. Click on the rank circle for the stock rank that you want to explore. You can also sort by rank to compare if share's rank is favourably placed within peer group. Hope this helps.