Quarterly Strategies Review: Guru screens off to a strong start in 2015

2014 was a year to forget for many of the 60 investing strategies inspired by the legends of finance that are tracked by Stockopedia. With the UK's main indexes generally drifting lower last year, weak sentiment and missed earnings targets hurt performances across the board. But the first three months of 2015 have witnessed a change of fortune for the gurus. Along with a general uptrend in the market, some of these strategies are flying.
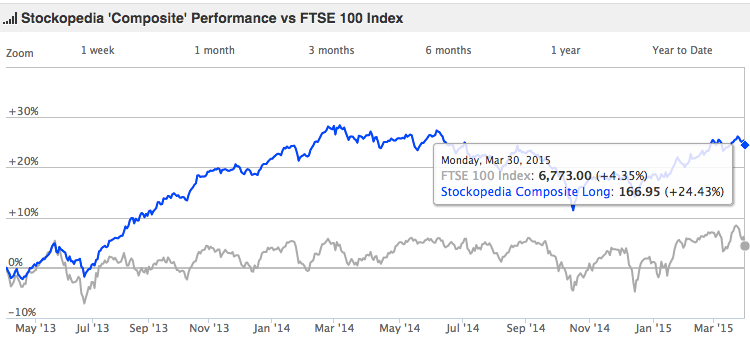
Overall, the Stockopedia Composite Long index - which aggregates the performance of all the guru strategies - rose by 4.9% during the first quarter. That was broadly in line with the market. Over the past 24 months the Composite is up by 24.4%.
Index / Strategy Composite | Performance Q1 2015 |
3.2% | |
6.2% | |
3.7% | |
5.6% | |
2.0% | |
4.8% | |
7.9% | |
Guru Strategy Composite | 4.9% |
5.4% | |
4.2% | |
7.0% | |
4.0% | |
8.0% | |
-2.3% |
During the quarter Stockopedia launched the new StockRanks portal. StockRanks score and rank every company in the market according to their Quality, Value and Momentum characteristics. In the first three months of the year, stocks with a market cap of at least £10 million and StockRanks in the top 10% of the market produced a return of 7.9%.
Top performing strategies
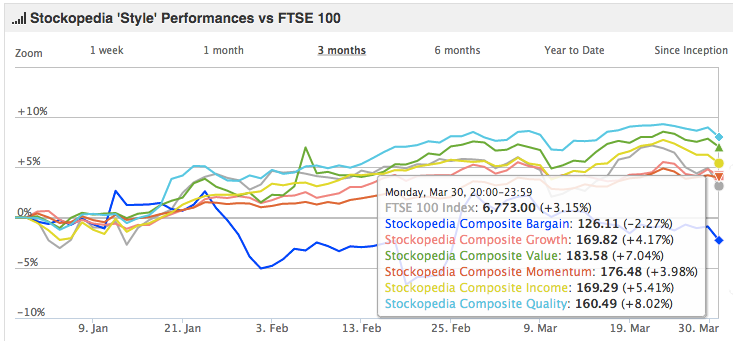
Overall it was Quality strategies that produced the highest returns during the quarter, at 8.0%. The Warren Buffett - Hagstrom screen produced a 19% return, albeit from just three stocks (the newly rebalanced portfolio comprises eight stocks going into Q2). Echoing the generally improved performance of the gurus in 2015, the Screen of Screens bounced back with a 14.4% return. Any stock can qualify for the SoS as long as it appears on at least four other guru strategies. In Q1 the performance was driven by companies including Marshalls, Johnson Service and UDG Healthcare.
Another notable Quality screen during the quarter was Joel Greenblatt's Magic Formula, which finished up 9.8%. The jury is still out on whether the Magic Formula is working again (after a period of underperformance). Its strong performance in Q1 was helped by taking a position in controversial insurance claims outsourcer Quindell at the turn of the year, which resulted in 240% gain.
Value strategies also performed very well during Q1, with the value composite up by 7.0%. Leading the way were the David Dreman Low PE and Low Price to Book screens, which returned an impressive 36.1% and 33.4%. In March we had a close look at these incredible returns (in Contrarian breakouts - Value stocks on the move) and found that many of the companies in the portfolios have value and quality characteristics that are often overlooked by some investors.
Elsewhere, the Ben Graham Deep Value Checklist also did very well, with a 17.4% return. Unlike the Ben Graham bargain screens, which performed poorly during the quarter, the Deep Value Checklist filters out micro-caps and tends to pick up bigger and better quality names - such as Berkeley Group, John Wood and Victrex. The median average StockRank in the newly rebalanced portfolio of 15 shares is a creditable 83 / 100.
Dividend Dogs race ahead
With the FTSE 100 stretching its legs to reach beyond 7,000 points during the quarter, it's perhaps little surprise that the blue-chip focused Dividend Dogs was the best performing Income strategy. It managed a 10.1% return during the period, with the median yield of the newly rebalanced portfolio being a little over 6.0%. In second place was the Winning Growth & Income screen, which has returned 8.6% over three months. The median yield in the rebalanced portfolio is 4.2%. And after a flat year in 2014, the Quality Income strategy also came roaring back, with a 7.7% gain (the median forecast yield here is 5.7%).
With composite returns of around 4.0% Growth and Momentum strategies got off to a steady start in 2015. Philip Fisher and Growth at a Reasonable Price were the overall high achievers among the growth screens, each returning 9.3%. Both strategies look for growth factors in stocks that aren't overpriced but there is very little overlap between the portfolios. The only stock they shared was easyJet. Among the Fisher screen's best performers was Optimal Payments, Space and People and Petrofac, while the GARP strategy benefited from positions in Mondi, BT and Telford Homes.
Finally, among the Momentum strategies it was Value Momentum and Earnings Upgrade Momentum that led the pack, with returns of 9.1% and 8.5%. The Value Momentum screen picks up stocks that appear cheaply priced but are trading close to their 52-week high prices. During the quarter it was an approach that found profitable trades in UDG Healthcare, Schroders and Savills. Meanwhile, the Earnings Upgrades screen had a huge winner in Betfair, which leaped by 42% while it was in the portfolio.
What to expect in Q2?
After last year's underwhelming and occasionally volatile market performance, 2015 has got off to a reasonable start. The guru strategies seem to be benefiting from improving confidence, with the main indexes testing new highs and even the Alternative Investment Market showing signs of an uptrend. Q2 will see a general election in the UK but it's likely that the market will be far more interested in seeing continued economic growth and, by association, continued earnings momentum. Quality and Value have been the star performing strategies so far this year, but it wouldn't be a surprise if Momentum catches up over the spring.
-----------
If you want find out more about hunting for big winners in the stock market, a free investment guide from Stockopedia could make a big difference.
Stockopedia's Guides to Making Money in Value & Dividend Stocks can help you become a more successful investor in 2015 and beyond. They are simple and straightforward reports on what works in the stock market and explain how to find shares that can enhance your returns.
Click here to find out more about Stockopedia and see our Subscription Plans to take a two-week free trial.
Disclaimer
This is not financial advice. Our content is intended to be used and must be used for information and education purposes only. Please read our disclaimer and terms and conditions to understand our obligations.

3 comments
I agree with Blissgull. In case his figures seem mysterious, the correct way to calculate the percentage gain over the quarter, assuming that the value of the portfolio at the start of the quarter is 141.32 and at the end of the quarter it is 152.41, is as follows:
{(152.41 / 141.32) - 1} x 100% = (1.07847 - 1) x 100% = 7.8%.
Subtracting 141.32% from 152.41% gives an incorrect result of 11.89%.
I hope I'm not being pedantic, but your figures exaggerate the gains made by the top Stockrank shares.
Looking at the performance chart, on Dec 31st last year the 90-100 shares had risen by 41.32% since the start. By March 31st that had increased to 52.41%.
That is actually a gain of 7.9% over the quarter, not 11.1%.
Still a very good performance showing the credibility of the Stockranks.
Hi, yes you're absolutely right, my maths was wrong there. Sorry about that - corrected.