Quarterly Update - the QVM portfolio

From mid-August this year, I’ve been running a little paper portfolio using the StockRanks as an experiment. I threw it together out of curiosity at first, not putting much work into it and the whole process taking no more than about 15 minutes. I have been pleasantly surprised by it all so far though so I thought I’d share the progress and my thoughts to date.
The process…
First off, I will outline the strategy itself and a few details as to how the portfolio is constructed etc. Sadly, I have played with the screen a little since formation date so can’t remember the exact criteria used but, roughly, they were as follows:
- StockRank over 90 (that’s the QVM part!)
- EV/EBITDA > 60% of the sector (to satisfy my bias towards value)
- Dividend yield > 60% of the sector (who doesn’t like a little income?)
- Piotroski F-score >=7 (to angle towards fundamental momentum)
- Market cap > £10m (to avoid the real tiddlers)
- Market cap < £1000m (to avoid those sluggish large caps)
That’s about it, my apologies if it’s not 100% accurate but it was something very close to that. I realised, in retrospect, that some of these criteria are unnecessary really, for example the EV/EBITDA and dividend yield requirements. All of this is already covered in the StockRanks and by putting the extra criteria in it probably just weighted the portfolio towards these couple of factors rather than ensuring a balanced exposure to a range of them.
From a portfolio management perspective, I decided that I would simply rebalance once a quarter (though I was a little late due to being very busy with work) and that I would include a £12.50 commission on every purchase and sale, as well as charging 0.5% SDRT for stocks with a full listing. Additionally, I chose to account for dividends, simply by making a note of the portfolio yield at each rebalancing date (around 2.2% at the start) and depositing cash equal to 25% of that at the end of the quarter. The portfolio started with a notional £1m, equally weighted across all stocks selected, with 25 stocks being the arbitrary number of companies chosen. To choose my 25 from the screen, I simply filtered by StockRank (I think…sorry if I am misremembering) and chose the 25 highest.
The performance…
I’ve actually been quite surprised by the performance – in a pleasant way! The portfolio formation date was the 17th of August and, given the downturn in late summer, this was quite possibly the least opportune moment to start a portfolio this year. The portfolio ended the first week around 8% down (although this is in part due to the initial drag of fees) but has made a steady recovery since:
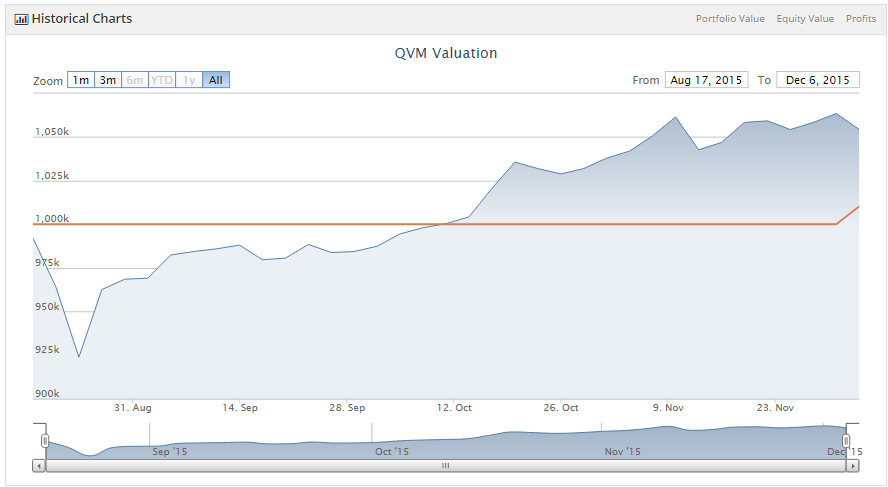
So by early December, including the dividends deposited (hence the uptick in the cash balance at the end), the portfolio sat at around 5% up – not too bad in my view, given that this is a period where the FTSE 100 is down around 4.75%. This means an outperformance of just under 10% in 3 short months and, other than the horrible start, it has actually been a relatively smooth ride to boot. It’s early days yet obviously but the result is certainly encouraging.
A little more detail…
By now you may be asking, what were the constituents and how did they perform? Well, I’m always one to take the bad news first so without further ado here are my losers:
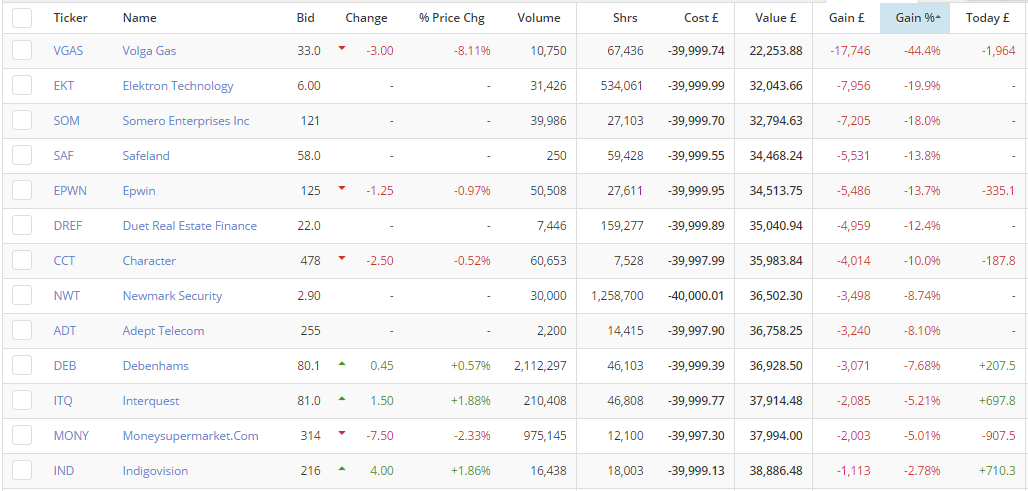
Obviously, the one that jumps right out is Volga Gas – this is a stock I wouldn’t have touched with a bargepole had I not been doing things systematically, and quite right I would have been! -44.4% in 3 months is simply dire and this stock single-handedly meant almost a 2% loss for the portfolio. Of course, the company is a gas company and we all know how that industry is faring at the moment. This leads me to think that there may well be some value in excluding industries which are exhibiting significant negative momentum. I haven’t done any research at all on the situation at Volga Gas but any bad news whatsoever in an industry full of bad news is likely to lead to the kind of result seen here, so perhaps we’re safer just passing on those ones until the overall picture looks a little better.
That disaster aside, Somero is a poor performer of interest to me – I hold the stock myself and am in a similar loss position to the portfolio here. I still like this company though and think it could do well yet, it also continues to meet all the systematic criteria so it shall remain in the portfolio at rebalancing. Character is another loser which I hold although one where I am sat on a nice profit currently. You can see the portfolio has not had such a good time here as it bought in at a much higher price – I feel like the stock was probably due a good pullback anyway so I’m not that surprised, but I still like and hold the company.
These two are interesting to me because if you had shown me the list of stocks at formation date, they’re two I would have definitely picked to be winners…probably because I owned them at the time and was victim to the host of biases associated with that. Obviously, from a fundamental point of view, I wouldn’t have declared them to be winners in 3 months but it’s a good example of how human judgement can detract from the performance of these screens.
Now for the better news:
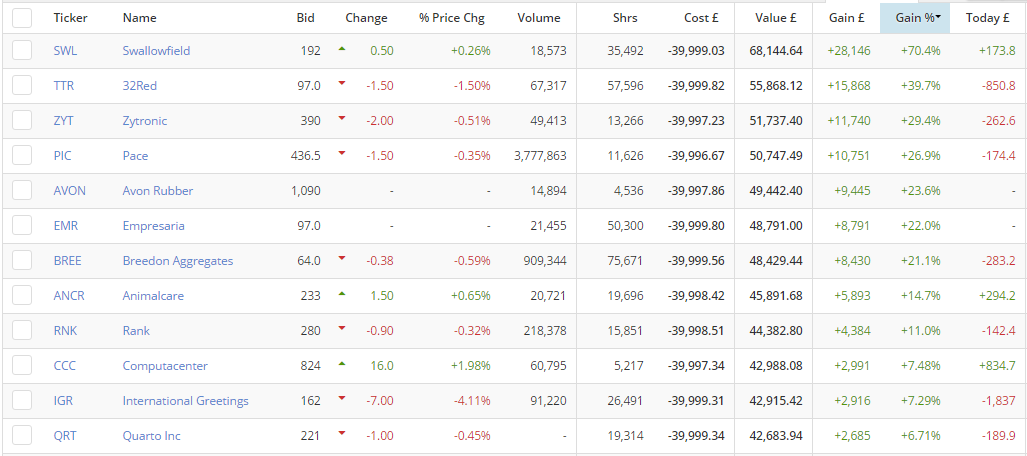
There are some excellent performances in there given so short a time frame (and don’t forget these are net of fees too). Again this is just fascinating to me because the two best are ones which I have briefly looked at in the past and just sort of skimmed over. 70.4% from Swallowfield is staggering and you can bet your bottom dollar that I would never have predicted that one myself.
Zytronic is of note – I wrote an article on the stock a while ago and actually really liked it (though I don’t own it myself). I concluded at the time that although I liked the company, the valuation wasn’t quite low enough for me to be fully satisfied I had my margin of safety…oh well.
You may notice that there are only 12 winners vs the 13 losers, with the outperformance coming from the excellent results displayed by the top few rather than from the majority of stocks doing well. This is in keeping with Piotroski’s finding (in Value Investing: The Use of Historical Financial Statement Information to Separate Winners from Losers) that value portfolios tend to have a win rate well under 50%, but that the winners just do so well that performance is strong overall. Again, it’s early days so I’m not claiming this to be a clear demonstration of these principles, just making an observation.
The revised process…
So, upon reflection, I have made some changes to the screen. The rules are now as follows (this way I won’t be forgetting them next time!):
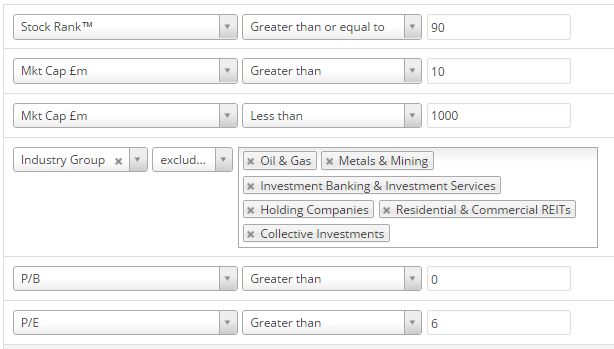
So, the first thing you might notice is the removal of the EV/EBITDA requirement and the yield requirement. I decided these criteria probably added very little value and that the stock ranks could be trusted to find a healthy balance between these and the myriad other factors. Size criteria remain in place as there is good evidence to suggest this has a positive impact on performance.
The biggest change perhaps is the exclusion of certain industry groups. Oil & Gas and Metals & Mining are in there for the reasons outlined in my thoughts on Volga Gas. The sectors are having a tough time at the moment so it’s probably best just to pass for now. As recoveries come around and positive momentum establishes itself once more, I will try to be on the ball and include them again but, ideally, I would automate this based on some simple industry momentum criteria.
The others are my attempt to remove all financial stocks (investment companies, banks, PE firms – the lot). Not because they are having a hard time per se, but simply because I was reminded of other screens while removing the O&G and M&M stocks. Joel Greenblatt famously advocates excluding financials as he believes they are not best valued in the same way as other companies. I agree with him and a number of others on this point, in particular when it comes to investment companies. I don’t know if this is a good decision but the StockRanks are not built with financials in mind specifically so I’m not sure how accurate a picture the valuation and quality components present.
The two additional criteria at the bottom are just my very simple way of excluding some of the fishy companies we’ve been seeing recently. PB > 0 simply ensures that the company has positive equity on the balance sheet – broadly this should help to exclude companies that are severely indebted or that have been loss making for significant periods of time in the past, both qualities of bad businesses. PE > 6 hopes to exclude ‘too good to be true’ valuations. Companies like Globo and some of the Chinese AIMers have all had rock bottom PE ratios in common and this should avoid a few of them. Maybe 6 is too low still but I’m not trying to identify every Globo with this screen and don’t want to miss out on the opportunity that a genuine company on a PE of 7, for example, may present.
A final addition has been to up the number of stocks to 30 – a little more diversification is probably a good thing but, to be honest, this decision is fairly arbitrary. We’ll see if it makes a difference! The screen suggests a large number of stocks so I have picked my next 30 by filtering by F-score and picking the 30 best. The F-score criteria itself has been removed but I still like the additional exposure to fundamental momentum it brings. As a result all the stocks have an F-score of 7 or higher.
The new portfolio and concluding thoughts…
To save taking a few more awkward screenshots and putting them together for you to squint at, I have just exported the new portfolio to excel and put it on Google Sheets for you to check out here.
The export was taken on Sunday right after the rebalance and before markets had had a chance to move. As such all of the stocks show a loss due to commissions, spreads and, in some cases, SDRT too. I note that Air Partner and Zamano have been hit hard by spreads and are starting the game at -4.44% and -7.01% respectively. That’s quite some hurdle to overcome so we’ll see how they do – I believe this to be reflective of reality though so won’t be changing anything. Besides, the first portfolio actually started in a pretty similar place and that turned out ok. Next time I’ll include one additional criteria to minimise exposure to large spreads but sadly I didn’t think of it on this pass.
Overall, I’m fairly happy with how the portfolio has done, especially for a difficult few months – it certainly wasn’t a disaster anyway and took less time to put together than reading a single set of accounts for any one of those companies. It’s not that I shirk hard work but that I place a lot of value in efficiency and appreciate that it just isn’t feasible for most people to spend significant amounts of time on individual company research.
My final observation is that despite this all being on paper, I was surprised to find it a little unpleasant watching it all go pear shaped in that first week. As Volga Gas then continued to plunge into oblivion I was even tempted to break the rebalancing rule and sell it… If it took a little willpower not to do so on paper, no wonder it’s so hard when it comes to the real thing!
Thanks for reading and I’ll report back in early March some time with the next update. I’d love to hear your thoughts on the process so please do share comments and questions below.
DISCLOSURE: Of all the shares mentioned above, I have long positions in Character Group, Somero Enterprises and Empresaria. Stocks chosen for the portfolios do not, in any way, constitute recommendations and are merely the results of my own experimentation and thinking.
Disclaimer
This is not financial advice. Our content is intended to be used and must be used for information and education purposes only. Please read our disclaimer and terms and conditions to understand our obligations.
7 comments
Don't forget the Q part of QVM heavily weights the F-score already, to quote the 'What is the QualityRank?' page "We heavily weight the F-Score given it's effectiveness, especially amongst small caps.". I think that by adding extra criteria to the QVM you may be duplicating some of its filters.
Absolutely - this was part of my conclusion and it's been removed from the updated rules. Had I thought a little harder at the start I probably would never have stuck it in in the first place. Thanks for your feedback though.
Tom
I not convinced about F scores so I will probably disregard that for now. What is clear is timing is everything, my top performer is Adept Telecom (LON:ADT) up 43%, in yours its down 8%. This is a problem I have with these selections and to a certain extent Stockopedia ratings. I think Ed's NAPS last January timed the selections exceptionally well, certainly since June I have not got anything like that. I have found 1 or 2 shares do very well and the rest cancel each other out. Like you I have about 50% win/lose.
Yes you are right 3 months is too soon to draw any firm concussions, I had a quick look at my NAP and the only low (5) F scores were Finsbury Food (LON:FIF), and Dee Valley (LON:DVW), and they have done quite well. The 2 highest Epwin (LON:EPWN) and Animalcare (LON:ANCR) have not done much, so the low F scores beat the high ones. My NAP does not include dividends that is part of the difference, divis are over 3% as I have a few high ones like City of London Investment (LON:CLIG), nor does it inc. fees but it does inc. the wide Stockopedia spread, really trading well within that in real life. Mind you you may have problems trading £40k in some of those stocks.
Yes excellent point - perhaps I should have just knocked a 0 off the opening balance and the results would be about the same but the ~£4k position sizes being a little more realistic. I did think at some point (but clearly forgot about it while rebalancing) that the £10m minimum market cap was too low for a £1m portfolio. I will move it higher next time.
Interesting what you say about your low F-scores doing the best! It shouldn't be a surprise given the concept is only really relevant when discussing broad selections of stocks, but the human brain just isn't wired up to accept that too easily...mine certainly doesn't seem to be anyway. I guess that's part of why these strategies appear to persist over time.
Tom
Had a quick look. Yes 5% is a good result, my NAP which started in June is only +2.5%. Maybe I need to incorporate the Piotroski F-score into my selections? Re Elektron Technology (LON:EKT) I did not think it paid dividends?
To be honest I think the precise return is a little random over so short a time frame so I wouldn't be rushing to change methodology just because of this! I do like the F-score though, not so much as a strategy in and of itself but because of Piotroski's finding that it could help to shift the whole distribution of returns to the right. This is further built on by the guys at Alpha Architect in their book Quantitative Value where they found it to be a statistically useful addition to a QV systematic strategy.
That said I've see a post here on Stockopedia fairly recently (though I can't remember where precisely), where the poster had found through their own research that the F-score did not result in historical outperformance in UK markets. I seem to remember this was a test of a pure F-score strategy however so I wouldn't necessarily take that as evidence that it provides no value as part of a broader strategy. Worth investigating further anyway in my view.
Re the dividends - yes you're right some of those stocks don't pay dividends, I was just accounting for them in a lazy way as I didn't want to look up dividend rates for each stock and input them manually. Instead I just took the average yield across the whole portfolio at the start (2.2%), and deposited cash equal to 25% of that to reflect that only a quarter has passed since formation.
So: 2.2% * £1,000,000 gives £22,000 in dividends, divided by 4 gives £5,500 that has been deposited. I know this is just a proxy but over time it should balance out to be fairly reflective of reality.
Tom