Hi All
I'll hold my hand up and say I'm completely and utterly new to all this and only joined last month. First post as well.
On the StockReport of a company, the top right-hand corner has various metrics under "Growth and Value" and "Quality".
I understand the visual Traffic Lights shown beside the metrics in these sections are there to visually indicate how the company ranks against other companies in its Industry and against the Market as a whole for that same metric.
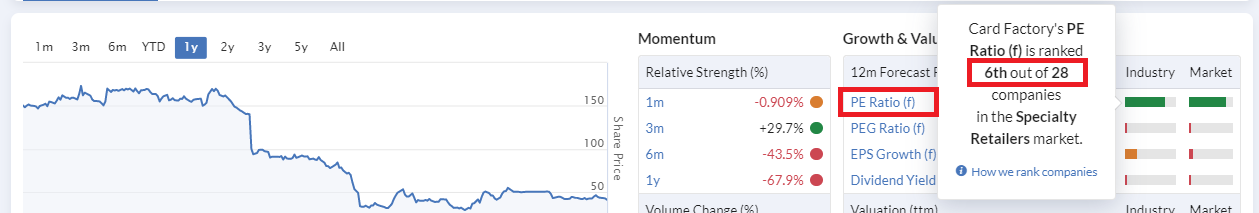
When I hover over one of those Traffic Lights, it gives me the company's ranking position as an "nth" place.
For example, for Card Factory (CARD), its PE Ratio (f) metric is currently 6th out of 28th within the Industry
For each company I'm considering investing in, what I'd like to do is work out their position for each of these metric as a percentage . This is so I can have a row on my spreadsheet that states "Rank above 80%?" for each metric and then can pop and tick or cross beside each company for that metric.
Looking at ranking within the Industry, I thought this would just be a case of dividing the position (nth) by the total number of companies in the Industry, multiplying by 100, and then subtracting the result from 100 to get the inverse (given that 100% would equate to 1st rank position, not last).
Taking the PE Ratio (f) for CARD for example, this gives me 78.57%
Worked out as 6/28 * 100 = 21.42, then 100 - 21.42 = 78.57
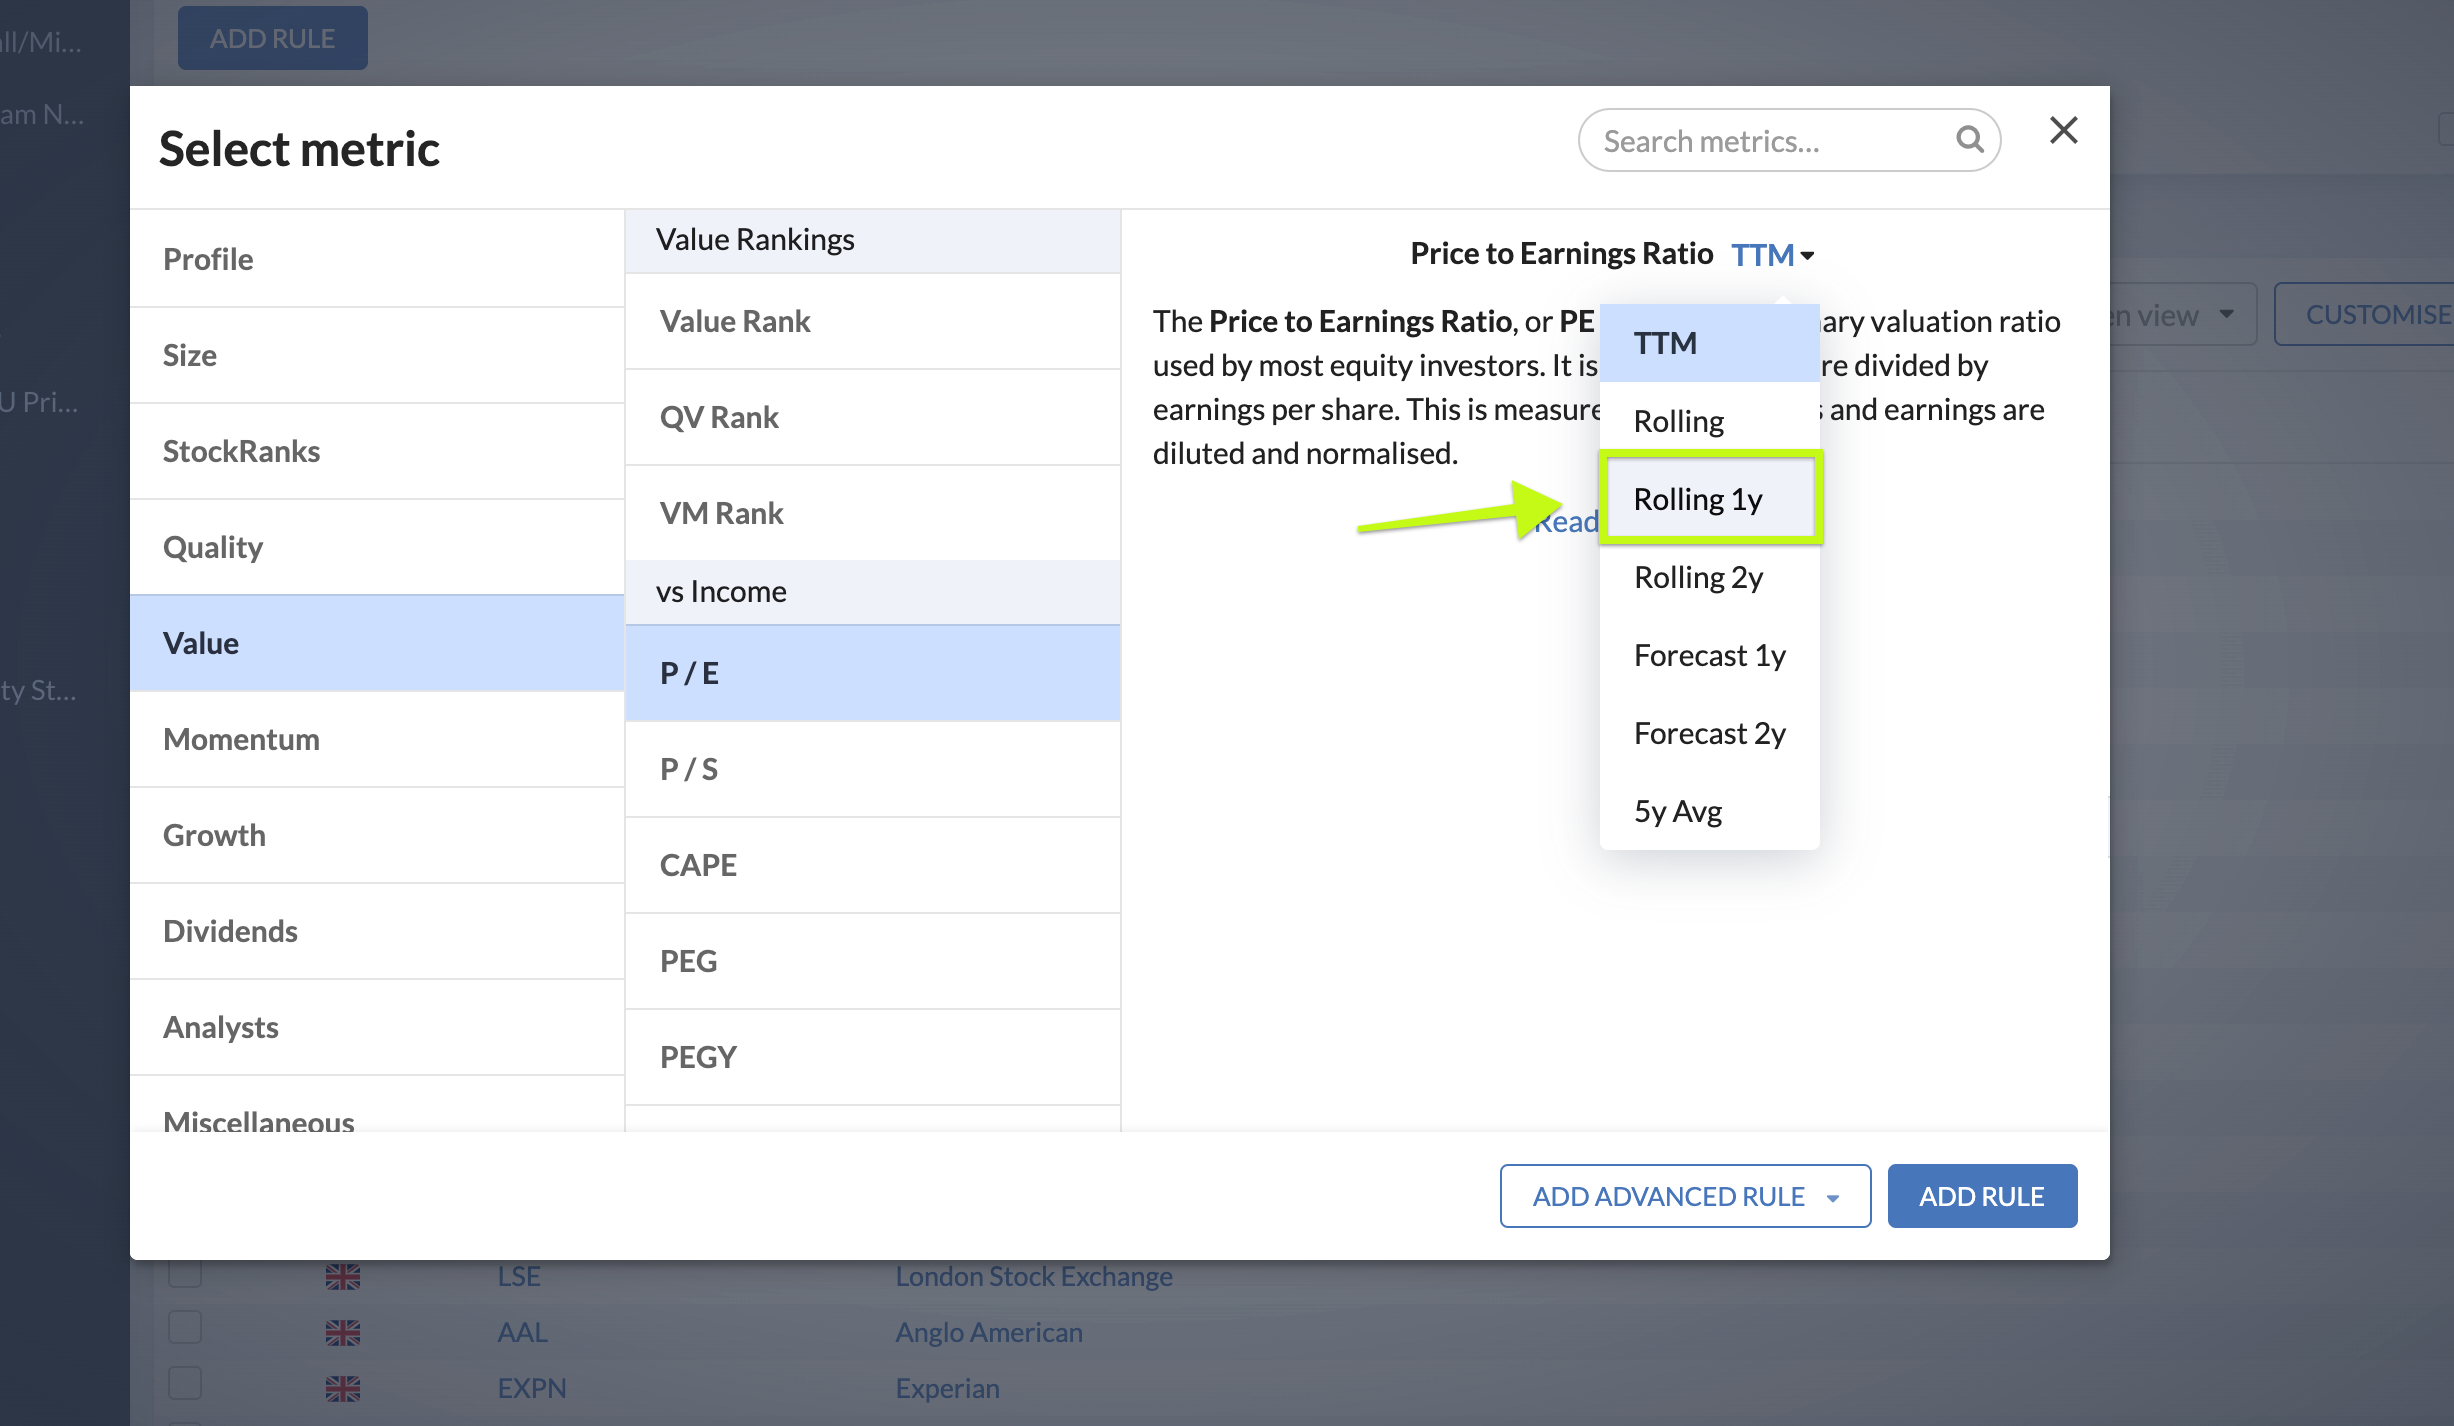
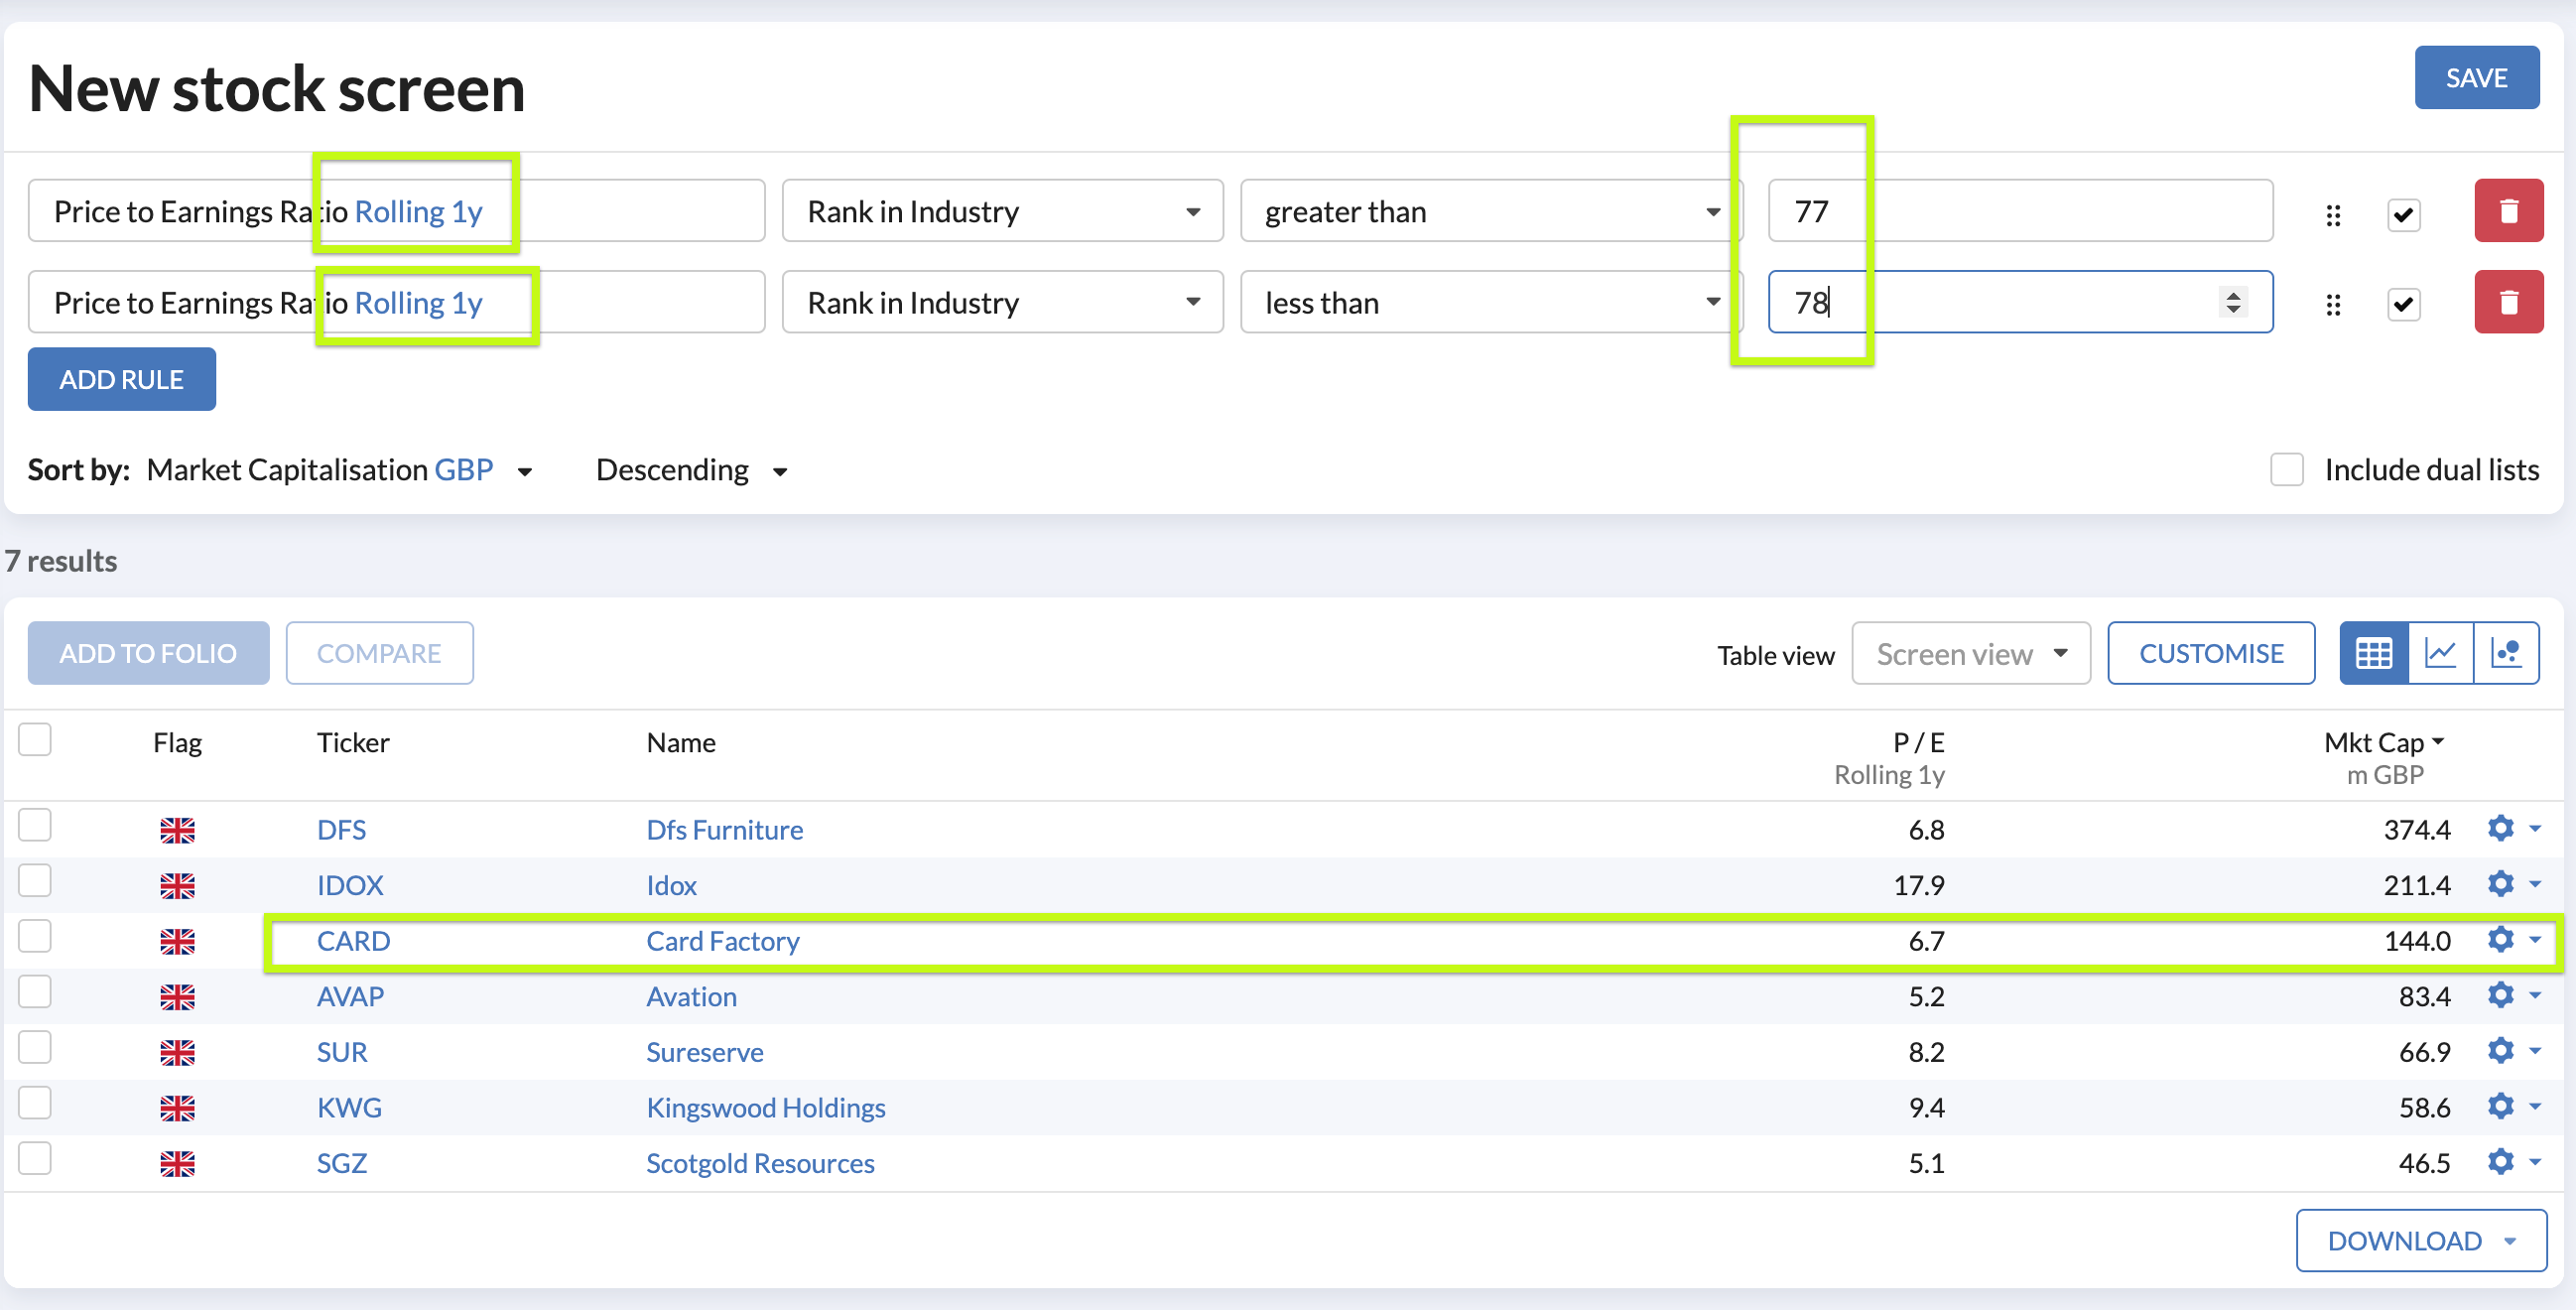
I then created my own Screen rules to check if I could "find" CARD, screening for companies where their P/E Ratio TTM is > 75 and < 80.
Below are the rules I used.

Puzzling to me, CARD doesn't show up in the list.
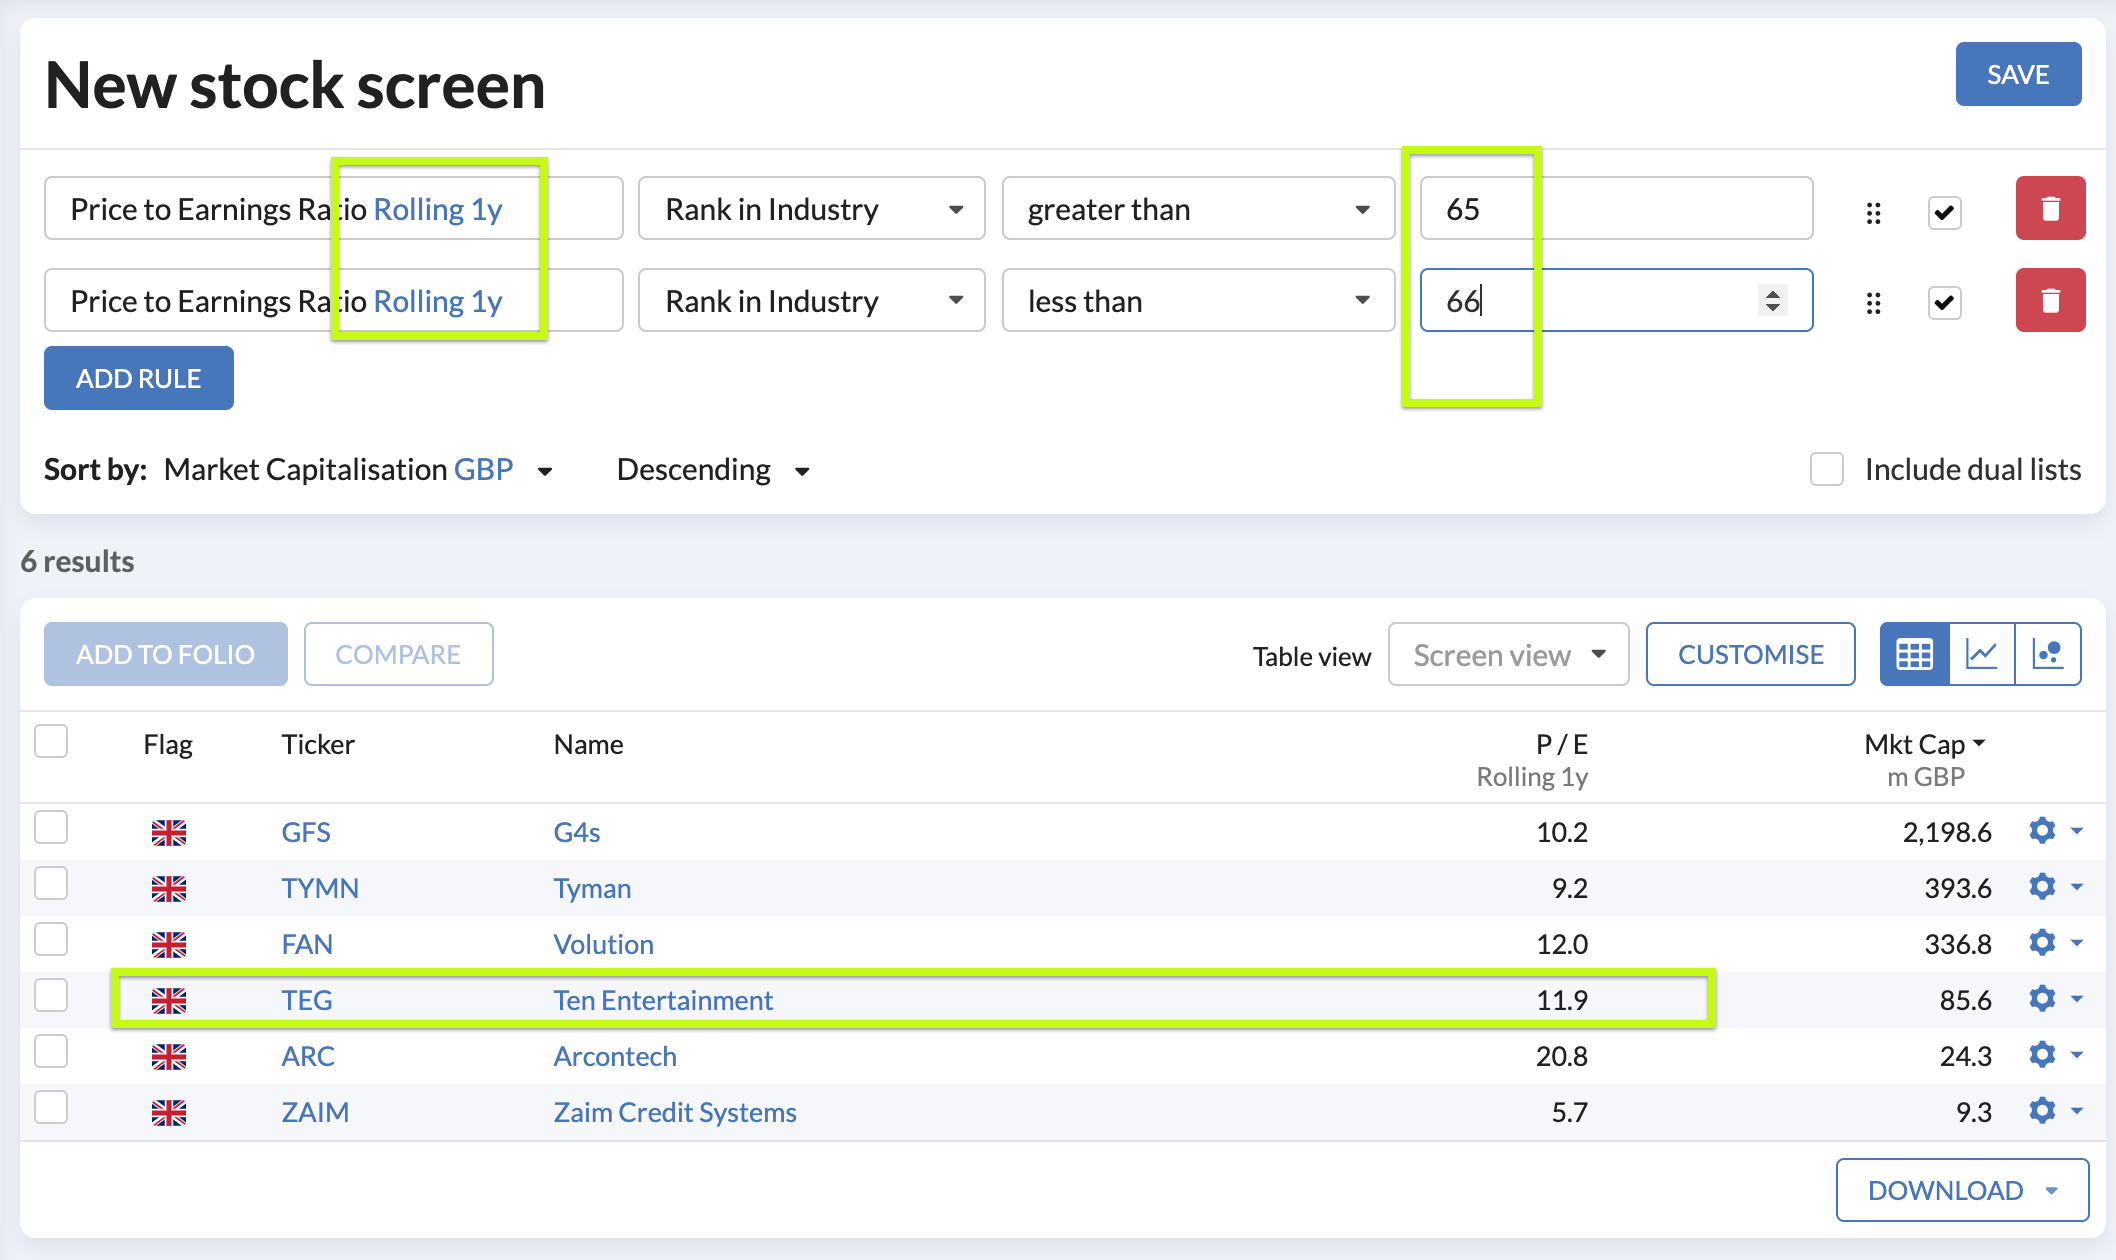
I've done the same with thing with another company, TEG, but find the same problem. TEG is currently listed as 9th out of 26 companies for its PE Ratio (f) against the Industry.
That would give me 65.38% as a percentage ranking using same math above (9/26 * 100, then 100 - result).
TEG doesn't appear when screening on P/E Ratio TTM with Rank in Industry values between > 60 and <70
Instead, TEG…