Getting an instant view of price & volume technicals just got much easier with the release of improved Mini Charts. You can now see traded volume and smart moving averages for stocks instantly right across the platform - including StockReports, the Today page, Screening and Folio Table Chart Views and even on blogs in Discuss.
Mini Charts are already a popular way of viewing basic chart trends without having to click away or launch full scale charts. They’re a huge time-saver and an essential component in the Stockopedia toolbox. You don’t need to be a technical analyst to benefit from Mini Charts, but these new upgrades should help those looking for quick ideas that can be taken further in the main charts area. Here’s what’s new:
Instant technicals - spot trends quickly without disruption
The two new technical indicators on Mini Charts are the moving average and traded volume. These metrics play an important role in understanding price and trading trends.
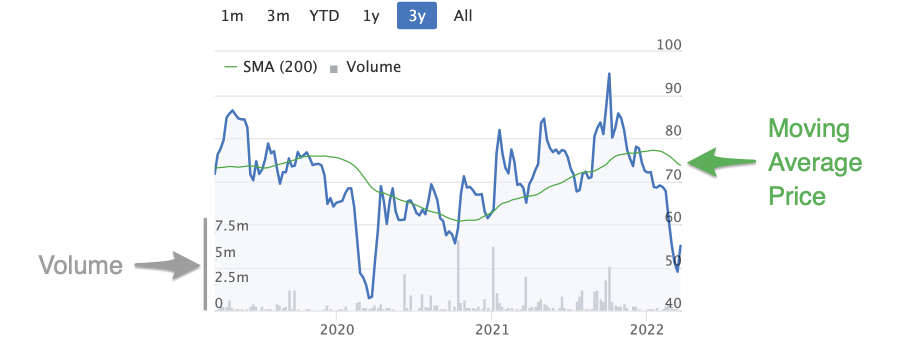
Moving averages smooth out the noise of daily price moves to give you a clearer view of trends over time, as well as potential points of support and resistance in up or down trends. Traded volume is a measure of the total volume of shares that have changed hands, and can be a confirmatory signal in securities that appear to be breaking out or falling sharply. You can read more about Moving Averages and how to use them in the Guide
By having this detail on Mini Charts, it’s much easier to see technical breakouts and trend setups. By setting a table of securities to Chart view, you can now breeze through long lists to get an instant view of what to ignore and what to explore:
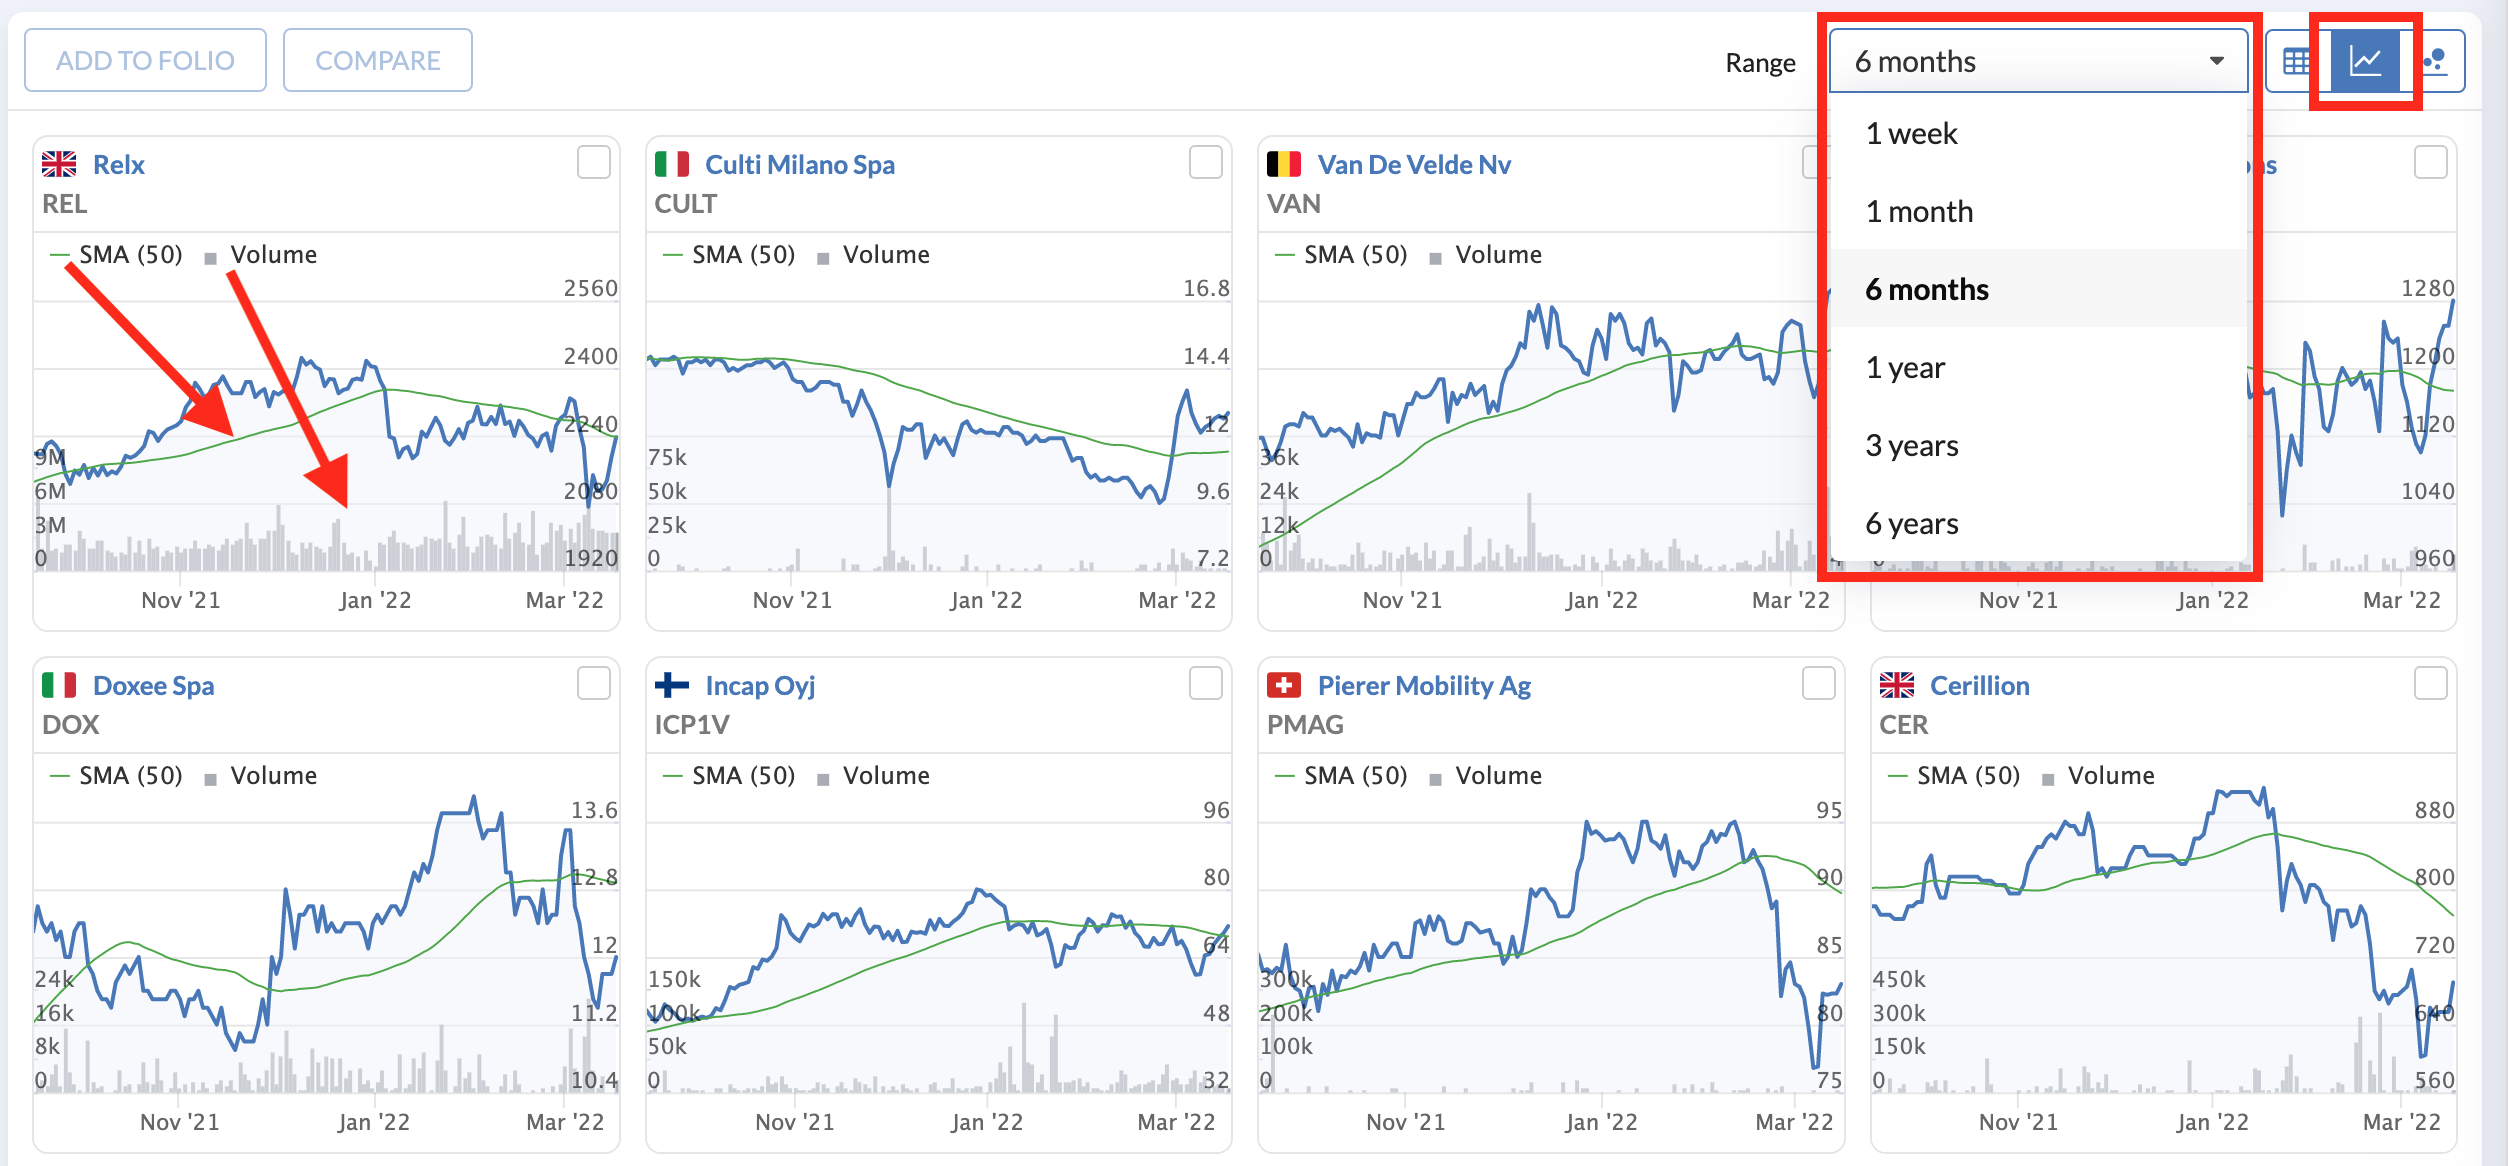
Chart flexibility - see technicals over your preferred timeframes
Mini Charts have always had adjustable timeframes, and we’ve kept that flexibility with the new technical data - giving you the option of seeing short and long term trends. In Screener and Folios tables, the date displays can be adjusted from anywhere between 1 week and six years using the menu at the top of the table.
As part of the adjustable chart timeframes, the moving averages are dynamic, which means that chart views of up to one year show the 50-day moving average. But…