Keeping track of all the market news can be challenging, especially during the busy results season. While some updates and results can lead to large price spikes on the day, others require a little more digging to identify why stock prices may have moved. To help you with this, we’re excited to introduce a new set of features designed to keep you informed on the key events for the companies you follow.
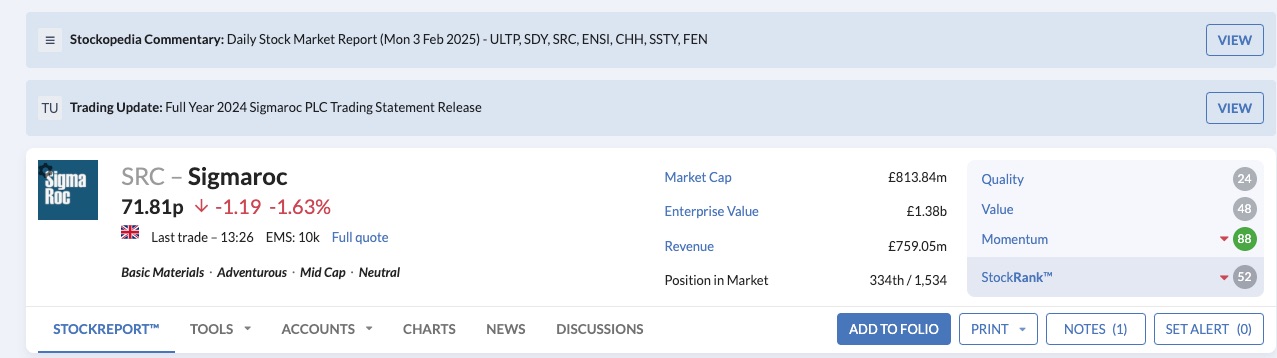
Banners on StockReport
Quickly identify significant company events at a glance when viewing StockReports. Previously we had informed you of when a company was suspended, delisted or in a takeover situation. We have now extended this to highlight companies that have released results or trading updates, are trading ex-dividend on the day plus any new commentary from our excellent analyst team.
Event icons on hover reports
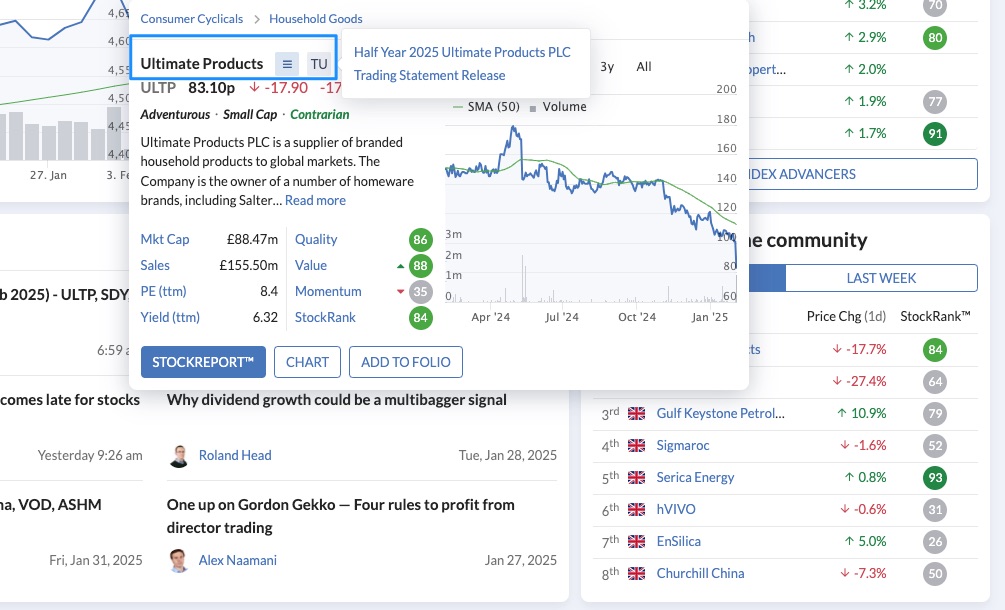
The mini StockReports that appear when hovering over a security are an excellent way quickly understand the profile of the company, especially when looking through a list of stocks such as on the ‘most viewed’ widget on the Today page.
We have therefore added the event icons at the top of the mini report to help provide a quick insight into what could be driving the movement of the share price on the day. If you hover your mouse over the icon, you will see further details on the event type.
Quickly find the most impactful events in your Folio
The Folio page is a key starting point for many of you as you try to assess how your companies are trading. To assist you with this, we have created the Events column that you can add to your Folio & Screen views. This again will highlight companies that have released results or trading updates, are trading ex-dividend or paid a dividend on the day or have new analyst commentary.
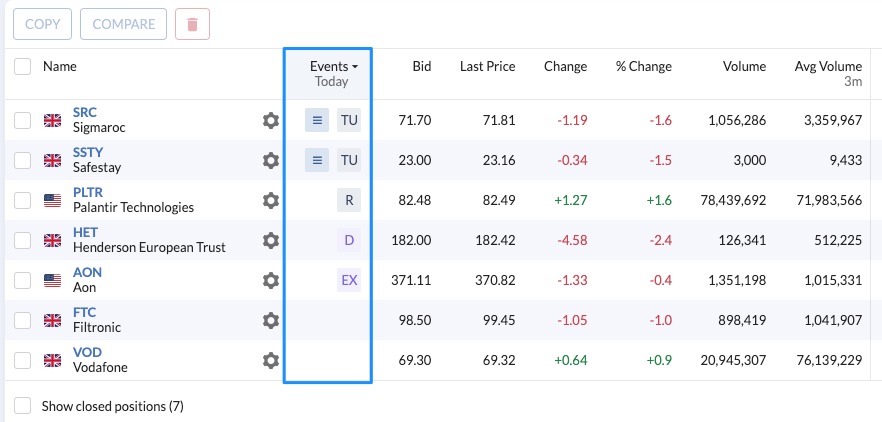
For most of you, this column will be automatically added to your Holdings & Quotes tables, however if you have previously customised your tables, you can add this…