Would any people, other than myself, like Stockopedia to change their share price graphs so that their price axes would always start at zero, or at least to have an option to display graphs in that way?
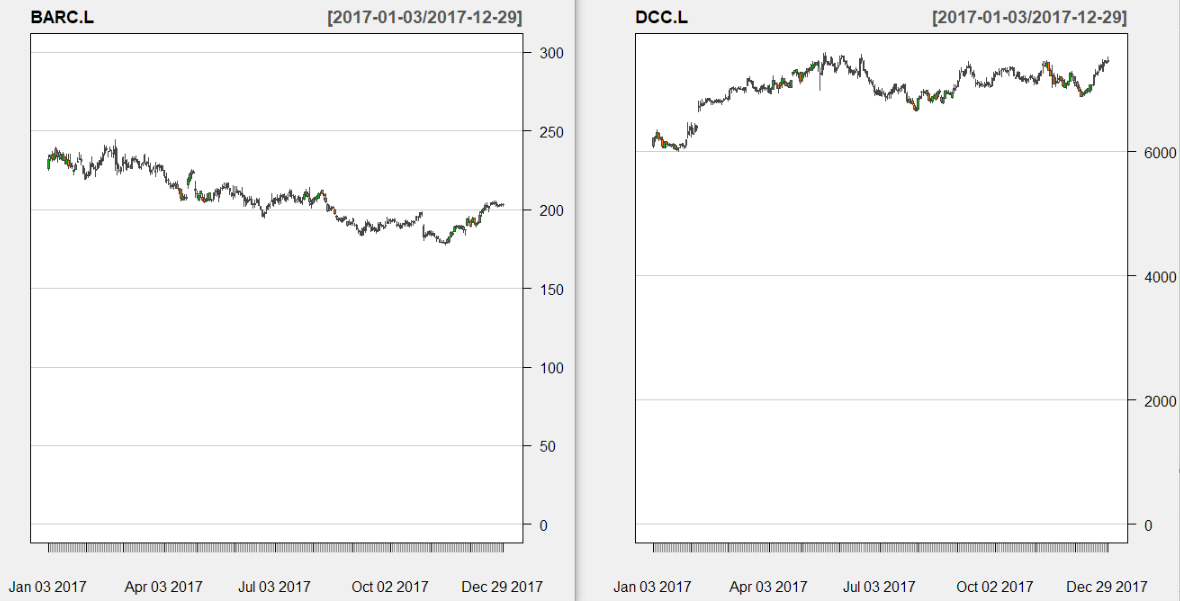
At present, the graphs have their price axes starting and finishing at the lowest and highest price, respectively, over the time-period of the graph. But that means a 20% increase for one stock over the selected time-period looks visually the same as a 200% one for another stock, which is very deceptive unless one is careful to read the numbers on the axes.
Truncating the y-axis, which is what the present graphs do, is one of the techniques recommended to fool people in this classic book:
https://en.wikipedia.org/wiki/How_to_Lie_with_Statistics
In our case, we're just fooling ourselves, but that's a very easy thing to do!


Try posting it in here..
http://ideas.stockopedia.com/forums/18977-stockopedia-pro-feedback