RSI - the most predictive ratio of all?

Stock pickers love ratios, but which is the most predictive ratio of all? Value investors often have a bias towards low PE ratios or high dividend yields, growth investors look for high EPS growth while those that prefer a blend often lean heavily on the so-called PEG. All of these ratios have some anchoring in one of the fundamentals of the underlying business - the earnings or dividends of the company. It seems smart to ensure that you are basing investment decisions on business fundamentals but the irony is that the most predictive ratio for future price returns is completely unrelated to the underlying business. It's based entirely on the recent movements in the company's share price and has come to be known as the Relative Strength Index or RSI.
The Relative Strength Index (RSI) was first developed by J Welles Wilder in a 1978 book called New Concepts in Technical Trading Systems. It is not to be confused with the better known plain vanilla Relative Strength which simply calculates the absolute price return of a share (using the starting and end prices over a time period) and compares it to the return on the market index. RSI is a little more complicated to calculate which is perhaps why it has traditionally been used more often by technical analysts and chartists than fundamentally oriented stock pickers. We think this is a shame as recent evidence shows that it may be much more predictive than plain vanilla Relative Strength.
How to calculate RSI
RSI uses all the price changes that occur over a given period in order to derive the average price change. Essential to the calculation is creating the ratio U/D calculated by dividing the moving average of the total price points gained on 'up' days (U) by the moving average of the total price points lost on 'down' days (D). This ratio is then 'indexed' to create a number that moves between zero and 100 as follows:
RSI = 100 - ( 100 / (1 + U/D) )
The reason technicians enjoy the RSI so much is that it can be used as an oscillator and graphically displayed underneath stock charts as depicted in the image below. Wilder believed that readings above 70 signalled an overbought stock whereas readings under 30 signalled an oversold one. RSI has generated a big following amongst day traders who use it over short time periods, but given that eight out of ten day traders lose money in the market it's perhaps wiser to find ways to use it over longer holding periods.

28 week RSI in backtests
Richard Tortoriello, in the excellent book 'Quantitative Strategies for Achieving Alpha', backtested the effectiveness of the weekly RSI using the S&P Compustat Point in Time database between 1992 and 2007. He discovered that the most consistent excess returns and consistency occurred using a 28 week RSI (with weekly rather than daily price movements). The top quintile of stocks based on their 28 week RSI reading outperformed the market by a huge 6.2% annually with 78% of stocks successfully outperforming the market - that would have worked out at an astonishing 16.7% compound annual return to turn a theoretical £10k into more than £100k over the 15 year test period.
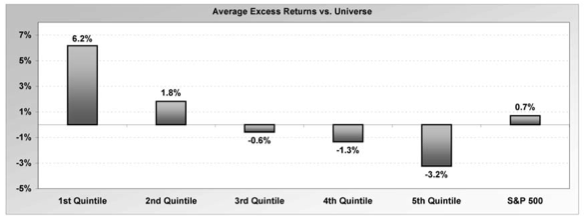
Tortoriello also tested the RSI on the downside. A shorter 16 week RSI was found to be most consistently predictive, with the bottom quintile of stocks on this measure underperforming the market by 3.7% over the next 12 months with 77% consistency. Anyone with market experience knows that stocks fall much more quickly than they rise which is confirmed by these statistics.
But, of course, with great power comes great responsibility ! Portfolios based solely on momentum indicators like the RSI display extremely very high volatility. Tortoriello found that top quintile RSI stocks had a maximum drawdown of 47% and a volatility of nearly twice the average for the market. Most investors just can't stomach that kind of volatility at all, which is probably one of the reasons that so many investors shy away from it, but of course momentum need not be used alone.
Combining RSI in a portfolio strategy
One of the great benefits of using momentum as part of a stock market strategy is that it plays so well with other ratios. Momentum is essentially completely uncorrelated with fundamental factors like valuation, profitability, cashflow and so on. As a result when used in conjunction with a fundamental ratio in a 'two factor model' the resulting portfolio has both a higher return and lower volatility than using either ratio is alone. For example Tortoriello when combined 28 week RSI with free cashflow growth the resulting portfolio returned 19.5% annually over the 15 year period.
Given the strength of the RSI as a solo factor and the wealth of material supporting it in Tortoriello's book, we will be adding the 28 week and 16 week RSI to the Stockopedia Stock Reports and screener in coming weeks. Another version of RSI is also available as an oscillator in our charts package.
As a reminder, you can sign up for a free trial of the Stockopedia Premium stock screener here: www.stockopedia.com/plans
Disclaimer
This is not financial advice. Our content is intended to be used and must be used for information and education purposes only. Please read our disclaimer and terms and conditions to understand our obligations.
11 comments
weekly rsi when builds above 65 level then watch rsi on daily chart let it go above 70 buy first dip then.stock pattern price moves sharp up when remains above 10dma and 21dma aligns above 50dma.exit on peak volume macd histo momentum above zero tapers down.Andrew Cardwell is master teacher of rsi.
At what point do we go through the looking glass?
I'm starting to strongly suspect lots of stock behaves like Minervini and other trading systems because people (lets face it, these days it's bots) expect them to behave in a certain way and try to trade ahead of the way they're "supposed" to perform creating the pattern they were supposed to create - in other words they create self-fulfilling prophecies that those with the most powerful calculators and internet access speeds can exploit best..
I also suspect the longer the bull market goes on, the more into line these strategies fall as the ai improves, the bots take over completely. As a PI you've got no chance trying to beat supercomputers and when the inevitable crash happens, good luck in trying to get out of those companies you've bought because the chart looked good.
All in my view. Others will have a different take :)
I like the RSI indicator and so when this topic popped to the top of the discussion list it caught my eye. Sorry I'm being so slow but it's still not clear to me what the top quintile of RSI means. Are we saying that if we have a population of 100 stocks ordered in ascending RSI values (where the lowest RSI value is in position 1 and the highest RSI value is in position 100) then it would be those with the highest RSI values i.e. in position 81-100 that would perform the best? This would be very counter intuitive... for me high long term RSI values tend to pick out stocks that are seriously overbought. I'm not saying I'm right and this is wrong I just want to confirm things before I turn my stock selection criteria upside down!
It seems that the RSI has not been yet added to the screener.
Will it be added in the future ?
I too would like to know when the 16 week and 28 week RSI will be added!
Does this mean that the RSI is going to be made a screenable factor in the near future?
Edward,
In your Oct 2012 article on the predictive qualities of the RSI, you said that you would be making the 28 week and 16 week RSI available in the Stock Reports and the Screener "in the coming weeks". They do not seem to be there yet. Is it still intended to offer these indicators for screening and assessment purposes?
He means those with the highest RSI.
The trouble with this sort of analysis is that when you start looking into it in detail you start to find that the timespan of the RSI makes a big difference to the outcomes. Note in the article that the optimum timespan for longs and shorts differed. It's very easy to come up with spectacular returns looking at historical data - sadly carrying those returns forward is a hell of a lot harder!
Peter
Hi Peter - the following is taken from the book - it clearly shows the optimum timespan. You probably could use anywhere from 22 to 38 weeks with equivalent results.
Ed,
Could you clarify, please: when you say "The top quintile of stocks based on their 28 week RSI", do you mean those with highest RSI reading (i.e. considered "overbought" in conventional T.A.) or the lowest RSI (i.e. most oversold).
Thanks,
Mark
Mark - yes highest RSI reading - top quintile / top 20% of the market by RSI reading. Remember this is a longer term indicator than is usually seen on TA charts. Those kind of charts often use a 14 day RSI which is I believe more of a classic 'overbought/oversold' indicator (I should have made that clearer). This is 28 week with weekly data. It's more of an intermediate 6 month momentum indicator in this scenario.