Screening for quality compounders: ten small and mid cap candidates

In September of last year, Nick Train of Lindsell Train commented in his UK Equity Fund report to shareholders:
“Broadly September in the UK stock market saw a sell-off in international “growth” stocks – after an amazing run, lasting years in some cases - and a rally in domestic “value” stocks.
More recently, an article written by Mark Donovan of Boston Partners and published on Robeco’s website caught my eye. In it, Donovan argues the case for a resurgence in value investing and points to a “subtle change in factor leadership towards value metrics.” He claims that all of the 31.5% gain in the S&P 500 last year came from multiple expansion and that “the last time such a multiple-fueled rally occurred in 1991 and 1998, it triggered periods in which value stocks outperformed for many years.”
I’ve seen similar comments from various sources in recent months. Certainly, there are high margin quality companies today that generate lots of free cash flow but look expensive - Unilever (LON:ULVR) for example - and low margin, capital intensive value shares that look cheap, such as J Sainsbury (LON:SBRY) .
But if we take the share price performance of those two companies over since 2015, we see a startling divergence in performance.
As of early February 2015
Name | Forecast PE | ROCE | Value Rank | Quality Rank | Share price (p) |
Unilever | 20.8 | 28.1 | 34 | 80 | 2,802 |
Sainsbury’s | 11.3 | 2.97 | 91 | 37 | 262.9 |
As of 11th February 2020
Name | Forecast PE | ROCE | Value Rank | Quality Rank | Share price (p) | Share price change |
Unilever | 20.1 | 19.9 | 31 | 83 | 4,689 | +67% |
Sainsbury’s | 10.3 | 3.2 | 81 | 13 | 202 | -23% |
Throughout this period, Unilever has remained much more expensive based on relative valuation ratios. Its ability to consistently generate high returns on capital shows it to be a much more valuable company, however. The longer you leave it, the more pronounced this effect becomes.
If you look at the two companies’ share price performances side by side over two decades, the results are even more striking:
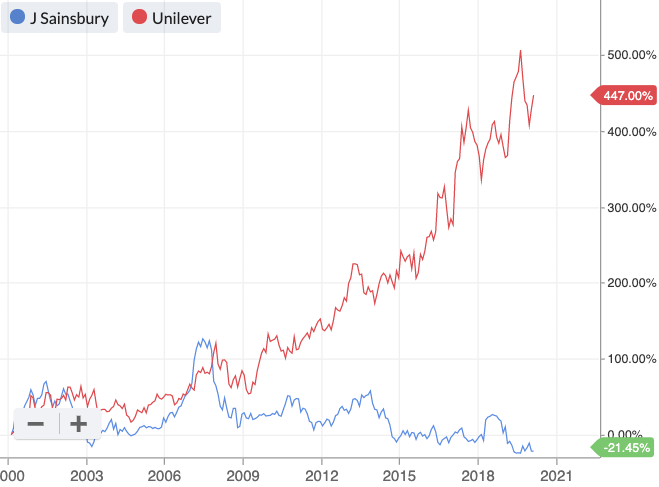
Of course, these are just two stocks and any other two might tell a different story. It’s still a powerful illustration of the perks of long term quality investing.
Markets are not perfect but neither are they completely inefficient. Most stocks with cheap valuations are priced that way because they are poor businesses. Conversely, some superficially expensive stocks are in fact cheap if you think of intrinsic value as the sum of future discounted cash flows.
It makes sense then, when Buffett says “time is the friend of the wonderful business, the enemy of the mediocre”. You begin to see how powerful simply screening for companies that have strong long term returns on capital can be.
The quality metrics that drive Fundsmith’s success
Fundsmith is also fond of old companies with established track records. The average year of foundation of Terry Smith’s portfolio companies was 1925.
In his own words, the Fundsmith style of investing is to:
- Buy good companies
- Don’t overpay
- Do nothing
These good companies tend to share some characteristics, namely: high long term returns on capital and profit margins, strong cash conversion, and modest to no debt with strong interest cover.
Underlying these financial metrics might be less quantifiable strategic advantages, such as: a strong commitment to product innovation and R&D spend, strong brands, control of distribution, good market share, a well invested operating base, efficient capital expenditure and value-enhancing acquisitions.
If we take his top 10 holdings and run them through some basic long term quality indicators, we get a sense of the business characteristics he looks for (note that these are US-listed stocks):
Name | QM Rank | Gross margin % 5y Avg | Operating margin % 5y Avg | ROCE % Long Term Avg | ROE % 5y Avg | FCF / Sales % TTM |
99 | 64.88 | 28.66 | 17.93 | 29.7 | 30.23 | |
92 | 47.51 | 15.23 | 11.61 | 12.5 | 21.70 | |
90 | 64.40 | 38.91 | 51.00 | n/a | 30.99 | |
93 | 84.41 | 41.59 | 19.83 | 20.8 | 30.00 | |
92 | 79.39 | 14.81 | 25.16 | 32.9 | 11.08 | |
84 | 84.41 | 43.65 | 87.34 | 77.9 | 29.14 | |
98 | 83.53 | 24.92 | 45.85 | 49.9 | 31.47 | |
96 | 55.82 | 20.92 | 54.29 | 332.0 | 12.63 | |
91 | 66.27 | 18.65 | 11.84 | 17.9 | 10.36 | |
90 | n/a | 62.37 | 22.17 | 28.5 | 53.45 |
Not only are these companies highly profitable, they have been so for many years. Most of them have long term ROCEs and five year ROEs comfortably above 20%. Their business models are also highly cash generative, with an impressive percentage of revenue translating into free cash flow.
A screen for quality compounder candidates
Applying a screen based on these criteria yields a selection of highly profitable, cash generative companies worth investigating.
This screen (which you can copy) has the following rules:
- QM Rank above 75
- Five year gross margin above 40%
- Five year operating margin above 10%
- Long term return on capital employed greater than 15%
- Five year return on equity above 20%
- Trailing twelve month free cash flow to sales above 10%
Sorting the results by QM Rank, here are the top 10 candidates:
Name | QM Rank | Gross margin % 5y Avg | Operating margin % 5y Avg | ROCE % Long Term Avg | ROE % 5y Avg | FCF / Sales % TTM |
99 | 92.23 | 39.01 | 22.25 | 27.6 | 39.33 | |
99 | 76.00 | 27.27 | 32.33 | 25.7 | 25.49 | |
99 | 69.43 | 23.52 | 50.43 | 49.6 | 22.18 | |
99 | 49.09 | 11.98 | 44.28 | 71.6 | 13.54 | |
99 | 40.31 | 14.33 | 30.33 | 29.1 | 10.62 | |
98 | 95.19 | 18.41 | 28.71 | 27.9 | 15.91 | |
98 | 43.54 | 10.27 | 26.33 | 25.7 | 10.74 | |
98 | 44.30 | 12.48 | 20.98 | 26.5 | 10.71 | |
97 | 62.86 | 30.11 | 39.56 | 36.3 | 23.27 | |
97 | 93.29 | 41.78 | 29.57 | 24.1 | 38.72 |
These companies share some of the traits of big, compounding successes of the past. While economic moats are notoriously tricky to pin down, screening for long term above average profit margins and return on capital figures might be the best way of honing in on likely candidates.
I use screens like this to identify stocks worth looking at more closely. I’m always interested to hear about screens others have created, so feel free to share the rules you implement. Also if you have any thoughts on this screen, let me know.
Focusing on things like long term returns on capital allows us to take advantage of a unique property of equities: the fact that a portion of your return is automatically reinvested in the company. It is this fact that creates the possibility of compounding investments, which is what I want to find.
As for that rotation into value, I’m with Warren Buffett when he says: “It's far better to buy a wonderful company at a fair price, than a fair company at a wonderful price.”
Disclaimer
This is not financial advice. Our content is intended to be used and must be used for information and education purposes only. Please read our disclaimer and terms and conditions to understand our obligations.

12 comments
In the context of this post the three uber-popular star fund managers - Terry Smith of Fundsmith, Nick Train of Lindsell Train and Keith Ashworth-Lord of Buffettology have announced their first quarter results - and it's a pretty mixed bunch:
To add to that the quoted Lindsell Train Investment Trust has only seen a 2% drop in assets but is 28% down in share price terms as the premium to net asset value has continued to unwind.
Broadly we can see that the two international based funds - Fundsmith and LT Global - have held up better than the two UK centred ones. Terry Smith indicates they've initiated two new positions, but doesn't tell us who, while Nick Train has announced that they've bought into Fevertree Drinks (LON:FEVR) and Pz Cussons (LON:PZC) in the LT UK fund. Keith Ashwin-Lord has announced that they've finished selling Air Partner (LON:AIR) and have also sold out of Restore (LON:RST) and Revolution Bars (LON:RBG) - it was never very clear what he saw in them anyway.
In general all of these managers tend to stay away from capital intensive and consumer facing businesses, which will serve them well in the downturn. A few quotes give the tenor of situation:
Keith Ashworth-Lord:
"The dreaded Black Swan event, or `unknown unknown' as Donald Rumsfeld would have it, struck with hurricane force and every tree in the forest was felled. All 33 holdings in the portfolio lost value with 19 of the falls being double-digit ... a net £29.3m was invested into buying more of what we already own. We ended the month with cash holdings of £143m, representing 12.7% of the net asset value. I am grateful to our investors who continue to appreciate that investment is a long-term activity."
https://basethree.s3.eu-west-1...
Nick Train:
" ... the Fund remains up to 99% invested in Equity –meaning it will participate in any eventual rally and recovery. A lesson from previous episodes of stock market panic is that it is impossible to identify the bottom and almost as difficult to get money invested after the market has turned –because prices rally so quickly. Although whether this panic will play out like previous ones is unknowable."
https://www.lindselltrain.com/...
Terry Smith:
"I have never been a believer in the philosophy that so-called “value” investments would perform well or protect your investment in an economic and market downturn. Shares in companies that are lowly rated are so mostly for good reasons. Because their businesses are heavily cyclical, highly leveraged, they have poor returns on capital and/or they face other structural or management issues. It doesn’t sound like a combination likely to protect the business and your investment in difficult times, and so it has proven thus far"
https://www.fundsmith.co.uk/do...
timarr
@simoan - The truth is that Fundsmith has a large momentum factor exposure whether we like it or not. There's no doubt that Terry Smith looks for companies with strong franchises which often have strong earnings momentum. He tilts to momentum regardless whether he actively selects for it.
This is the best holdings list I can get across all his funds. The averages are as follows:
It's a premium priced set of holdings strongly weighted towards Quality and Momentum.
@simoan - The truth is that Fundsmith has a large momentum factor exposure whether we like it or not. There's no doubt that Terry Smith looks for companies with strong franchises which often have strong earnings momentum. He tilts to momentum regardless whether he actively selects for it.
My own portfolio (and I suspect many others) also has a large momentum factor at the moment because like Fundsmith it's done rather well in the recent past, but the M factor as calculated by Stockopedia had very little to do with my original reason for selecting investments - we mustn't confuse the two things.
I very much doubt Terry Smith pays any attention to moving averages, broker EPS upgrades etc. that make up the Stockopedia M score. I believe from reading the annual report that he often buys when the M factor of a strong franchise is low. One of my own favourite fishing grounds is the Stockopedia "Falling Stars" category i.e. quality companies that are going through a rough patch.
All the best, Si
I know I'm late to this post but this is something that's been bothering me for a while.
You've hit upon the key limitation of Momentum ranks on Stockopedia - if a stock has a rank >70 you've probably missed the boat in may respects and it's not a "good" stock because its got high momentum, it's got high momentum because its a good stock - that's why people bought it. I'm never sure if the StockRanks performance charts relate to the rank at the start of the measured time period or if it's taking all the best rated stocks as rated now and looking retrospectively. If it's the latter then it's not very useful for stock picking at all...hence why I sympathise with your approach to look for "Falling Stars"....but yet seems entirely counter-intuitive to the point of a Stock Ranking system e.g. a good system would help you pick future winners, not just point at the previous winners and say "look how well these did". I imagine some of the best performers had relatively low ranks when it was the best time to buy in.
As a result I don't really rely on them too much, I download the data and put it through my own models.
It shows the performance of the stocks as rated at the start of the time period. Anything else would be pointless.
It may seem counter-intuitive to you but in fact stocks with high momentum do tend to continue to have high momentum.
However it is very much a probabilities game. The low-M stocks have about a 40% probability of out-performing the market and the high-M stocks have about a 60% probability.
It would be really useful if there was a quick way to see what a given metric value is in terms of its percentile rank.
For example you have a rule:
Now is that aggressive or mild? Where does it come as a rank? If we could ask that for all your rules we could see whether some rules are being too aggressive or too mild when building a screen.
You can specify a ranking based rule instead, but then you are guessing again because there is nothing helps you find out what rank to try. Even a short decile table for each metric would be useful maybe as part of the glossary info.
The "Op Mgn" and "ROCE LT avg" rules do not appear to be doing very much. If I turn them off only one extra stock matches. So the obvious question is "why?". Are these rules too mild compared with the others or are they shadowed by other rules (I think that is what is happening: ROCE - shadowed by a stricter ROE rule and Op Mgn is shadowed by a stronger Gross Margin rule)
The Gross Margin rule is interesting because it eliminates quite a few stocks because they do not have a Gross Margin entry even though they have an Op Mgn entry. (I am not sure why that would happen.)
Very interesting article.
Taking the Terry Smith second criteria "don't overpay" I think you can make an argument to add something along the lines of :
While in the long term this approach should pay off, I'm also interested in maximizing the odds for a good start as once achieved it is easier to relax. Whether the trigger for a good start is valuation or technical shouldn't matter for this, as long as they do work (I've been seeking a verifiable, objective, repeatable, technical trigger that works for me for a while). What the correct values/criteria are I don't know, however, buying close to highs, although counter-intuitive and counter-value, at least ensures downtrends haven't started and does have a psychological foundation.
There are two 'forces' at work in the wiggly lines you illustrated. Longer term trending and shorter-term mean reversion (to the longer term trend).
I'd love to be able to add 'PE high/low bands' to Stocko charts.
I only track P/E and "P/E rolling" but I can show you how they have changed for SBRY and ULVR.
I was a bit surprised to see that there are some strange jumps in the values. But you can see by eye where the ratio is above or below a long term average, although I am not sure there is a useful pattern here. (It would be useful if we could plot the history any of the Stocko metrics in their charting tool.)
Thanks Nick
(It would be useful if we could plot the history any of the Stocko metrics in their charting tool.)
It would indeed. Many years ago I saw a chart that plotted previous years high and low PE multiplied current years earnings (and for the current year forecast) and it, in retrospect, seemed a reasonably good 'envelope'. No doubt that it was cherry picked or it would be just too easy and arbitraged away if consistent.
In many ways this is the same theory behind this https://www.stockopedia.com/screens/geraldine-weiss-lite-dividend-screen-80?view=5b261c84eebdd and I've always wanted the ability to test that for myself. It would probably turn out to be largely useless but it bothers me that I can't easily find out.
Pre stocko I followed a quality-trending strategy that targeted 'steady climbers', buying when they rose above a PE of 20, selling when they fell below 25. This came to a halt when the few candidates were either taken over or refused to fall to 20 after dipping to 25. 20 and 25 were chosen arbitrarily; as you say visibility of distributions would be a useful addition to the tool set - as well as a great way to find data errors.
Jack,
I don't understand why you have conflated the Fundsmith approach to investing with the Stockopedia QM rank? The two have very little in common. Momentum (as defined by Stockopedia) forms no part of the Fundsmith investment process and I don't understand why your screen uses it?
A high QM is completely incidental to what Fundsmith do and if you have a fund with 27 fairly equally weighted holdings you'd maybe expect the top 10 holdings to have higher M than the bottom 10. For instance, Sage (LON:SGE) Diageo (LON:DGE) Reckitt Benckiser (LON:RB.) Intercontinental Hotels (LON:IHG) and the aforementioned Unilever (LON:ULVR) are also holdings and all have QM ranks well below 75.
All the best, Si
Hi Simoan,
The QM Rank is something I look for when investing so I added it to my screen. I included this column for Fundsmith's holdings for the sake of completeness as it was already going to form a part of my rules further in the article. Perhaps I could have been more explicit about this.
To be clear, I'm not saying Terry Smith is a QM investor - in my writing I only reference quality profitability and cash generation measures in relation to Smith's investing style.
Rather than strictly replicating Smith's style, I'm using it as a jumping off point for my own screens, which often look for high QM.
The QM Rank is something I look for when investing so I added it to my screen. I included this column for Fundsmith's holdings for the sake of completeness as it was already going to form a part of my rules further in the article. Perhaps I could have been more explicit about this.
Fair enough, but as you say this is not clear from your text. I hope you can see that on reading your piece it is about the relative performance of quality vs value with no mention of momentum whatsoever. So it's a bit incoherent, especially when you mention Fundsmith and put up a screen that produces a list of companies that Terry Smith wouldn't touch with ten bargepoles joined together end on end.
All the best, Si