March 10, 2018
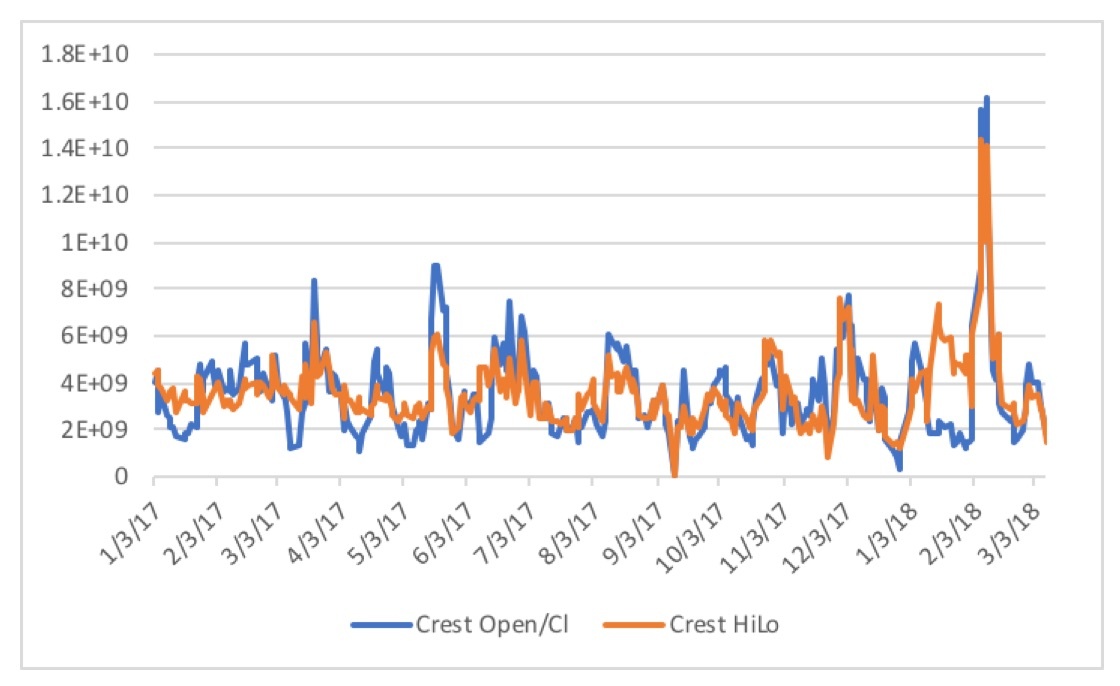
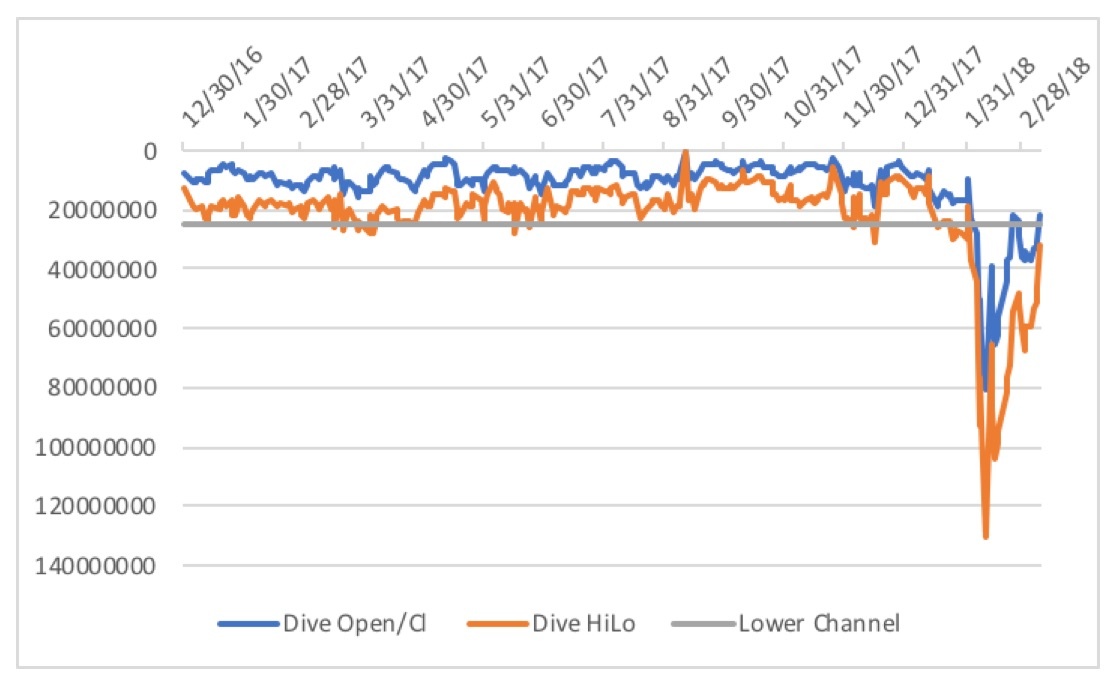
A look at the Crest chart[1],[2] for last Friday, March 9, reveals, not surprisingly, that the crest is over. The chart is back to its baseline, indicating the market is in a build-up phase. By contrast, it’s counterpart, the Dive chart[2],[3], provides a different message. While it does show that the dive is mostly over, it has yet to recover its lower channel, indicating that there may be more downside movement in store.
S&P 500 Crest Chart 3/9/2018
S&P 500 Dive Chart 3/9/2018
A study of major bear markets[4] indicated all of them gave advance warning a month to 5.4 months prior to their big drop. This came in the form of a sizable drop. When that initial drop was a correction, five out of six times the market topped within 2.9 to 5.4 months.
As I have written previously[5], demographic forces will cause a sizable decrease in consumer discretionary spending, which will precipitate an economic downturn. Profits will shrivel as a result of the downturn. From these lofty valuation, the level of disappointment that will descend upon Wall Street will be of such magnitude and proportion that a mega bear market is inevitable. If this market follows form to all other major bear markets, then we should be seeing a market top come no earlier than 2.9 months after the initial peak January 26. That would place it around April 20.
Yet, last Friday’s high of 2786.57 is only 3.0% away from the January 26 peak. That is only 0.4% away from the topping range found in my study. Is it possible we are going to reach the drop off point early this time? A look back at the previous six major bear markets that went through a correction before toping, showed that all but one dove steadily to the bottom of their correction period and then recovered sharply. The only notable exception was the 2000 market whose S&P 500 performance during that span is compared to ours in the chart below. The left-hand scale belongs to the orange 2000 market, while the right-hand scale belongs to today’s market in blue.
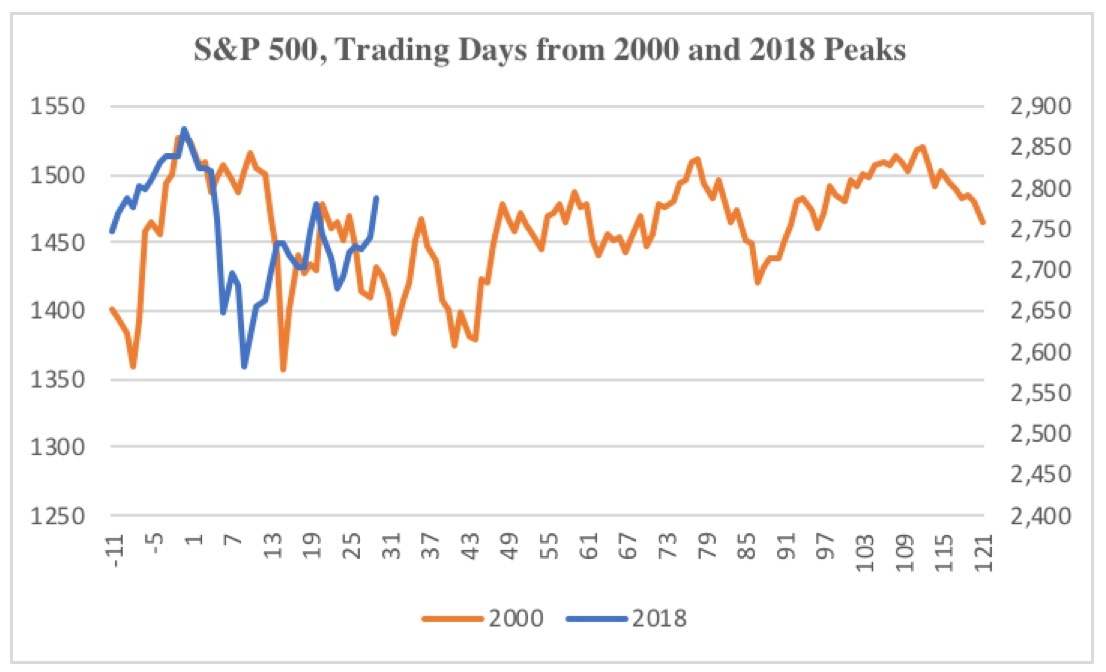
Note that both markets dove sharply not long after their initial peak only to…