I recently heard a discussion on a radio phone-in show about the idea that windfall taxes should be levied on companies whose profits have been increased by the coronavirus pandemic.
Inevitably, supermarkets were put forward as one potential target. The argument was that record sales during the lockdown period would be likely to result in record profits. Against this backdrop, supermarkets are benefiting from the 12-month business rates holiday that’s been granted to all retail, leisure and hospitality firms.
Perhaps conveniently, all three of the big supermarkets have said that the extra costs incurred handling the pandemic will roughly match the savings on business rates. So bumper profits seem unlikely, although I still expect a robust performance.
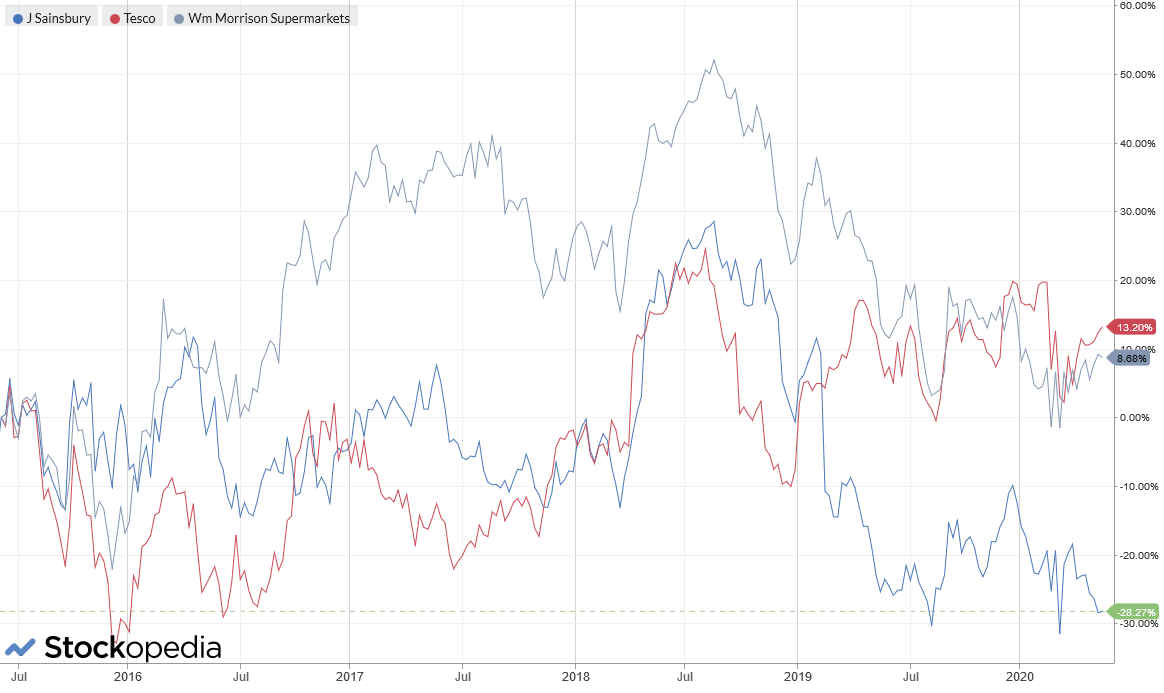
The politics of this situation are not for me to discuss. My interest today is J Sainsbury (LON:SBRY), a business that’s significantly underperformed its two listed rivals over the last five years.
Rather to my surprise, Sainsbury’s almost qualifies for my SIF stock screen at the moment. The only area where the orange-topped retailer falls short is with its earnings yield of 6.5%, which is below my 8% minimum.
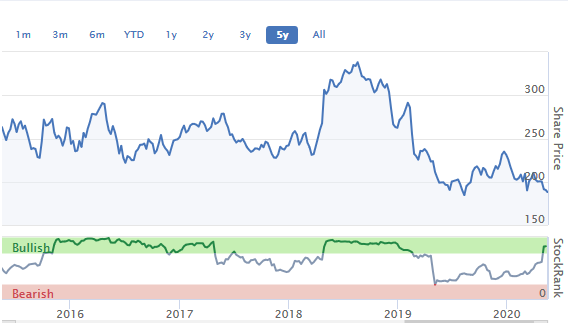
This has prompted me to take a closer look, especially as the retailer’s StockRank of 85 suggests that the Stockopedia algorithms have a positive view of this stock. Indeed, these ratings indicate that the stock is no longer seen as a value trap, as it was in February.
With a new chief executive due to start work on 1 June, is this finally the right time to buy Sainsbury’s shares?
Deep value
Sainsbury’s ValueRank of 73 suggests that the stock scores well on measures of value. At face value this is certainly true.
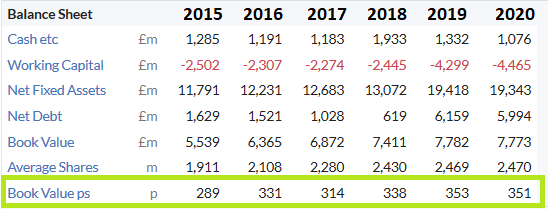
Asset value: At the time of writing, Sainsbury’s shares are trading at 187p - a discount of almost 50% to their book value of 350p per share. If we strip out intangibles and focus on tangible net asset value, the stock still looks cheap when compared to its NTAV of 305p per share.
However, this situation isn’t new. The retailer’s share price has tracked consistently below its net asset value for a number of years, as these two graphics illustrate:
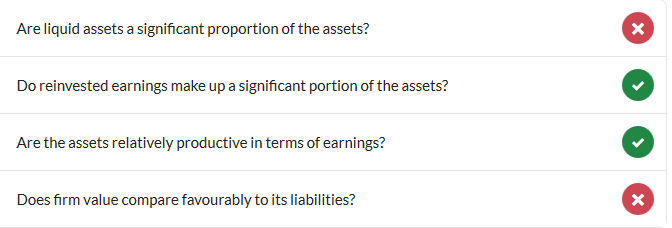
Leverage: One reason…


