Shares in pawnbroker and gold dealer H&T Group have risen by 75% over the last three years. They’ve tidily outperformed the wider AIM market, which has risen by just 2.5% over the same period.
I first wrote about H&T for this column in July 2015, when the shares were trading at about 200p. I commented that the shares looked good value, but remarked on H&T’s falling margins.
My conclusion was that H&T had “decent upside potential” and could continue to outperform the market. I’m happy to say I’ve been right so far. The shares have risen by 25% since my article was published last July, while the dividend has risen by a chunky 75% to 8.4p.

H&T hit a 52-week high of 300p in August, after the company revealed a 42% increase in pre-tax profit for the first half of the year. But this has been followed by a broker downgrade and a sharp sell off.
H&T stock is now trading 16% lower at about 250p. This gives investors a chance to buy in at levels last seen before July’s surge begun. The question is whether this is a buying opportunity, or a warning of worse to come.
I’m particularly interested in H&T as this stock recently qualified for my Stock in Focus screen, making it a contender to join the SIF Portfolio. As I don’t currently have any financial stocks in the portfolio, the temptation to diversify is strong.
In the remainder of this article, I’ll take a closer look at the figures and decide whether to add H&T to the SIF Portfolio this week.
Is the price right?
H&T’s ValueRank has fallen from 87 to 73 since I looked at the stock in July 2015. Back then, the shares traded on a trailing P/E of 11.4 and a trailing P/FCF of just 5.6! Here’s how things have changed:
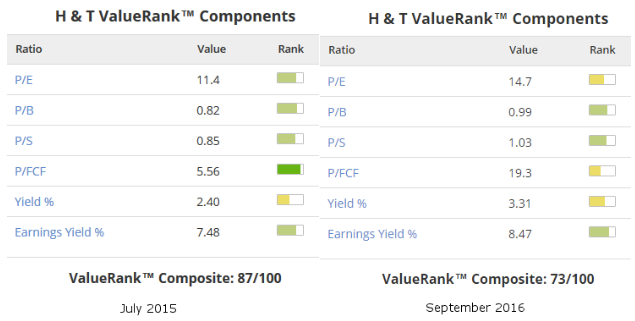
Over the last fourteen months, H&T’s profitability has improved, along with its dividend. The stock’s earnings yield (op. profit/EV) has risen from 7.5% to 8.5%, while the dividend yield has risen from 2.4% to 3.3%.
In my view, this offsets the increase in valuation. The price/book and price/sales ratio both look undemanding at 1.0. Asset backing is strong, with net tangible assets of 209p per share.
You may have noticed that H&T’s price/free cash flow ratio has…