SIF Portfolio: Small-cap Harvey Nash could be a profitable recruit

One of the hazards of building stock portfolios using screens is that the stocks which qualify change from day to day. Having taken a look at the Stock in Focus screen results on Monday night, I had a clear idea of the company I was going to write about on Tuesday.
Fast forward eighteen hours, and my choice has gone from the screen results. This highlights something that’s worth noting if you use Stockopedia’s Guru Screens (or indeed the SIF screen) to help guide your personal stock choices. The portfolios which are shown and tracked by Stockopedia aren’t likely to be the same as those you build, even if you use the same screen rules to select your stocks.
I don’t think this is a big problem. As the saying goes, There’s Always Another Stock. The nature of screening means that there’s no reason to think that a selection made this week will be better or worse than one made using the same rules next week. It will just be different.
This could be a good one
Despite being cheated out of my original stock, I’m quite happy with its replacement. Harvey Nash is a small-cap recruitment stock with a StockRank of 98 and apparently strong value credentials.

The group operates globally in three sectors, executive search, professional recruitment and outsourcing services. According to last year’s results, “80% of the Group’s clients, services and skills are in the technology and digital sector”. Given the sizeable operation in Vietnam, where it has 80 fee earners, I’d guess the client base includes major consumer electronics firms.
Operations span Europe, the Americas and Asia Pacific. However, 78% of gross profit came from the UK, Ireland and mainland Europe last year. So it’s clear that while the group does benefit from geographic diversity, the health of western European markets is important.
Last year saw revenue rise by 16% to £784.3m. This was an increase of 6% in constant currency. However, operating profit fell by 12% to £9.2m, a drop of 20% in constant currency. The company said this was the result of currency headwinds in Vietnam, and “weakness” in Hong Kong and Singapore. USA performance accounted for 17% of gross profit, but was hampered by bad debt write-offs totalling £1.5m.
Despite these pressures, the group’s cash generation remained strong and net cash rose by £5.4m to £5.6m last year. That’s a positive for income investors, who may be tempted by Harvey Nash’s 5.5% forecast dividend yield.
The stock looks cheap
Harvey Nash has a RiskRating of Adventurous and a StockRank Style of SuperStock, according to the new classification system. These, plus a StockRank of 98, suggest that this stock has the characteristics of those that have historically outperformed the wider market.
A ValueRank of 98 suggests that the stock is cheap, too. All the main value ratios are represented by a sea of green:
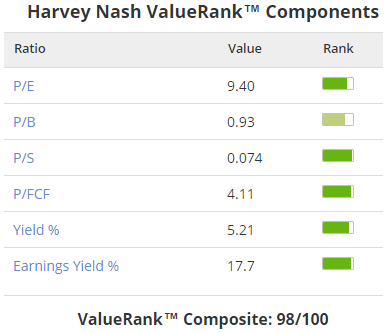
Harvey Nash appears to be cheap on a variety of measures, but I think these are worth a closer look:
Earnings (P/E): The P/E of 9.4 shown in the graphic appears to relate to the group’s statutory earnings, not the more favourable adjusted figures. So that’s a positive, given how cheap it is.
Book value (P/B): I’d be wary about attaching too much significance to this. Most of Harvey Nash’s book value is intangible assets of £55m. I don’t think book value is an appropriate measure for a people business. Looking at an alternative choice, the stock’s net current asset value, calculated as current assets minus current liabilities, is roughly zero. So in a liquidation scenario, shareholders probably wouldn’t receive anything. This isn’t an asset play, in my view.
Price/sales (P/S): Very low, but probably irrelevant. I’d imagine this includes a lot of pass-through revenue used to pay salaries for contract staff.
Price/free cash flow (P/FCF): Definitely not irrelevant. Harvey Nash generated a lot of cash last year, thanks partly to £7.4m of working capital gains. But the group also reported a cash outflow of £6.2m relating to a subsidiary that’s now been sold.
Stripping out both figures plus interest payments of £676k gives me an estimated underlying free cash flow to equity of £5.6m. This puts the stock on a P/FCF of 10, in line with the P/E. That’s attractive to me.
Yield: The trailing dividend yield of 5.2% corresponds loosely to cash dividend payments of £2.9m last year. So free cash flow cover for the dividend is about 2x. Again, that’s attractive.
Earnings yield (EBIT/EV): The earnings yield threshold for my screen is 8%. Stockopedia data shows Harvey Nash having an earnings yield of 17.7%. Dividing last year’s reported operating profit of £9.2m divided by the current enterprise value of £52.1m confirms that this is correct.
What could go wrong? The risk, of course, is that these profits won’t be sustainable. Harvey Nash’s value depends on its network of fee-earning recruiters and on client demand. I’m prepared to assume that the company will continue to operate successfully, but I’ve no way of judging likely changes in demand.
However, value investing is a numbers game, in my opinion, and Harvey Nash scores highly.
A popular pick
A QualityRank of 65 is less impressive, but doesn’t highlight any serious areas of concern. Harvey Nash has generated a five-year average return on capital employed (ROCE) of 13.9% and has a Piotroski F-Score of 7/9.
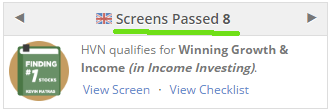
It’s also worth noting that this stock qualifies for no fewer than eight Stockopedia Guru Screens. That puts it fifth from the top of the list. The only stocks qualifying for more screens are four of the top housebuilders...
Momentum is vital
At the time of writing, Harvey Nash is the top-ranked Value-Momentum stock in Stockopedia’s UK stock universe. Strong momentum will be essential if this is to be a profitable investment for the SIF portfolio, so what can we learn from the figures?
The stock’s MomentumRank of 89 is promising:
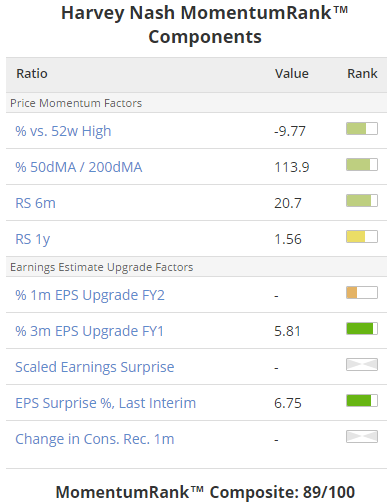
Price momentum looks reasonably strong, The stock has recovered some of the losses seen over the last two years and is up by 24% over the last year. This puts it slightly ahead of the market and thus provides a positive 1-year relative strength reading.
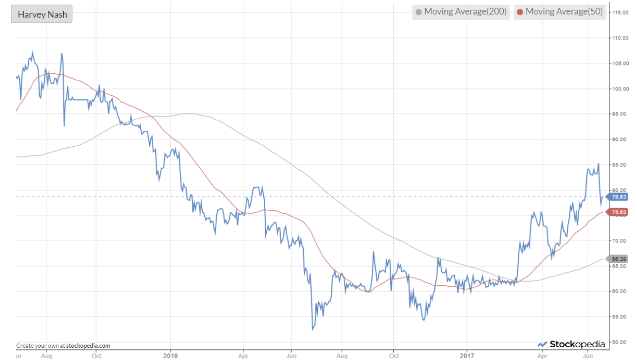
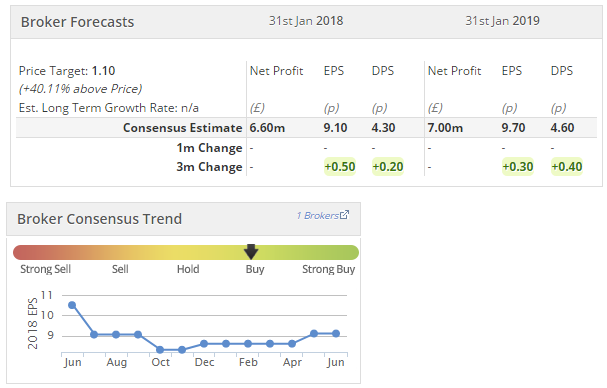
Earnings upgrade momentum is also quite good. The firm’s most recent figures (published in April) were slightly ahead of consensus estimates and appear to have prompted a round of broker upgrades:
My decision
Harvey Nash trades on a 1-year forecast P/E of 8.6 and offers a well-covered dividend yield of 5.5%. Although the market has priced the recruitment sector as a risky buy, I think it’s possible that these fears have been overdone.
This stock passes all my screening rules and appears to be in good financial health. I’m going to add it to the SIF portfolio this week. As usual, I’ll buy some for my own portfolio after this article has been published.
Disclaimer
This is not financial advice. Our content is intended to be used and must be used for information and education purposes only. Please read our disclaimer and terms and conditions to understand our obligations.

6 comments
Indeed - It's narrowed now to 79.25 / 80.75 (less than 2%) - Fair enough in a tranquil market but with 7%+ earlier today being much more the norm - A swift exit here (in volume in particular) warning is surely appropriate.
Hi Roland,
Thanks for this very interesting article. I am currently interested in a different US recruitment company, where some people seem to view the EV/Sales ratio as a relevant way to assess the valuation potential once the company moves from turnaround mode in to a more stable state. As such, I was interested in your comment that the low Price/Sales ratio here is probably not too relevant, due to large amounts of pass through revenue (for contractors) - do you have any further information on this, or know if the company disclose a breakdown of revenue to help analyse how much is inflated due to pass through?
Thanks.
Hi clouds,
Thanks for your comment. I haven't found a breakdown of revenue showing how much of it is passed through in the form of wages/salary, but my assumption is that it's a fairly large proportion due to the numbers involved:
2017 revenue: £784m
2017 cost of sales: £686m
2017 net profit: £5.98m
The eventual net profit is so small, relative to revenue, that I've assumed a large proportion of the cost of sales must represent pass through to contractors.
My view on EV/sales would be that it could be a useful measure of value if you have a clear idea of the level of profitability that's expected after a turnaround. But if you're not sure what kind of margins to expect, then I'd have thought there might be a risk that EV/sales will make a stock seem cheaper than it really is.
All of this is my opinion only, obviously. I'm happy to be corrected by anyone who knows this sector better than me.
As regards your US stock, it might be worth checking whether pass through revenue is reported in the same way under US accounting standards as it is here in the UK. If it's reported differently than the most appropriate valuation metrics might also be different.
Regards,
Roland
Disclosure: I own shares of Harvey Nash.
What a spread !!!!!
Yes, the spread makes in uninvestable for me.
Hi Matylda,
The spread for Harvey Nash (LON:HVN) can be wide, but it does vary and isn't always too painful. For example, Stocko is showing 187bps (1.87%) at the moment, which I don't think is too bad in this context.
My broker is quoting slightly inside this for smallish deals. If dealing in size, then multiple purchases are likely to be required to get the best prices, but that's not unusual with small caps.
Regards, Roland
Disclosure: I own shares of Harvey Nash Group.