SNAPS 2020 - the benefits of a good, long sleep

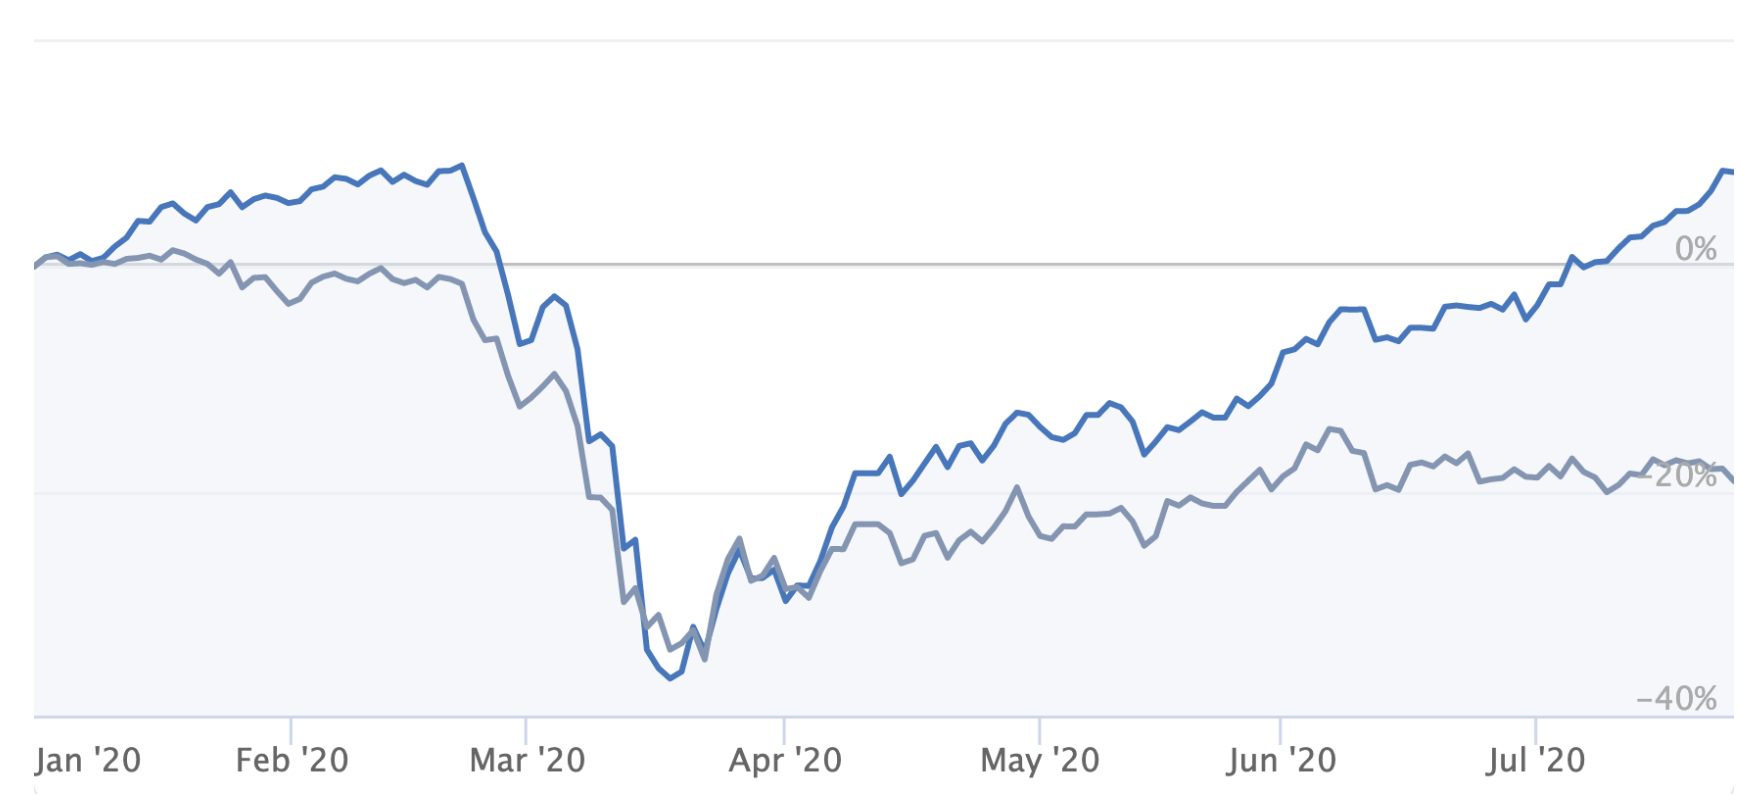
As of July 25th, this year's NAPS portfolio has done rather well. The NAPS are currently up 8.5% year to date, versus a FTSE All Share benchmark that is down 19.1%. That's a 28% outperformance in the first six months. While the portfolio is still below its high watermark from June 2018, it's actually broken out to new highs relative to the benchmark. I'd love to say it's been a smooth ride, but as we all know there's been a nasty virus knocking about and the markets stumbled badly in March.
One of the great benefits of the NAPS process is that embedded within it is this idea of only checking once (or twice) per year. If we'd just gone to sleep for 6 months and woken up to check the NAPS valuation, we'd have had the pleasant surprise of seeing it grow. In this article I'll explore the fact that it's been to hell and back in the interim and whether that matters.
If you are a new reader, you may have missed the journey I've had with the NAPS strategy over the last five and a half years. In essence it's a systematic, diversified, 20 stock portfolio based upon the StockRanks that only takes an hour per year to put together - accordingly, I've titled it the "No Admin Portfolio System" or NAPS for short. You can learn much by going through the NAPS Archives or watching one of the old Youtube Webinars. I do hope to create a course about the methodology in due course.
[This is a long piece, if you want a PDF version you can download it by clicking here]
Recent Performance
After a useful early run, a fairly brutal viral attack knocked 40% from the portfolio in February and March. Serendipity then provided a 70% rally over the last 4 months. The line in grey is the FTSE All Share which I always use as a benchmark. There is fairly strong and enduring momentum recently, which has been driven by a 10% allocation to gold stocks.
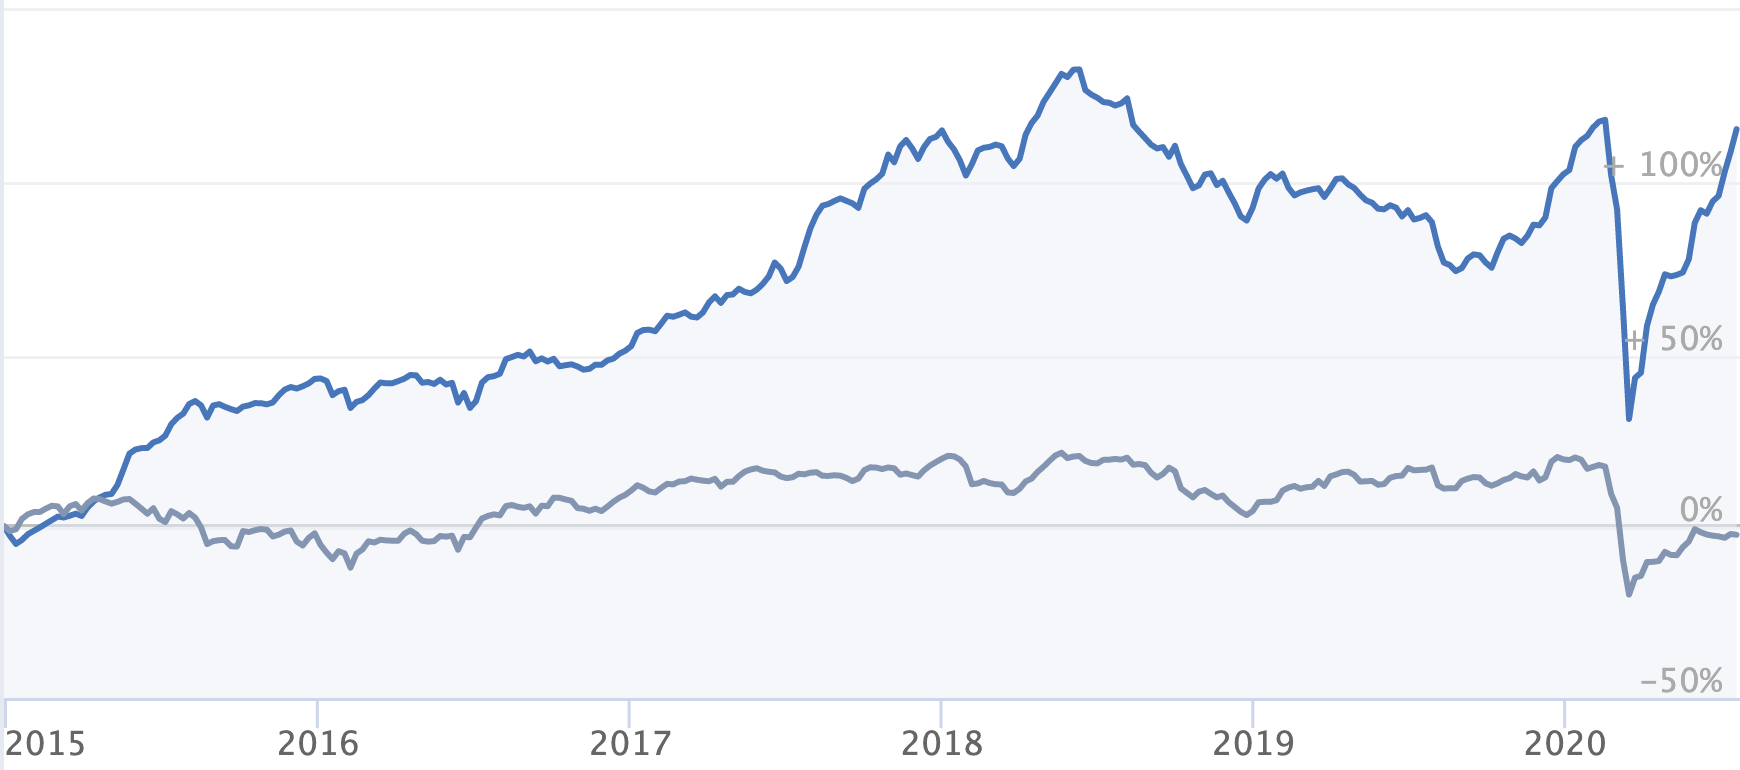
Here's the five and a half year performance history of the portfolio, a 118.5% performance excluding dividends. This chart illustrates the extent of the whipsaw we've seen of late.
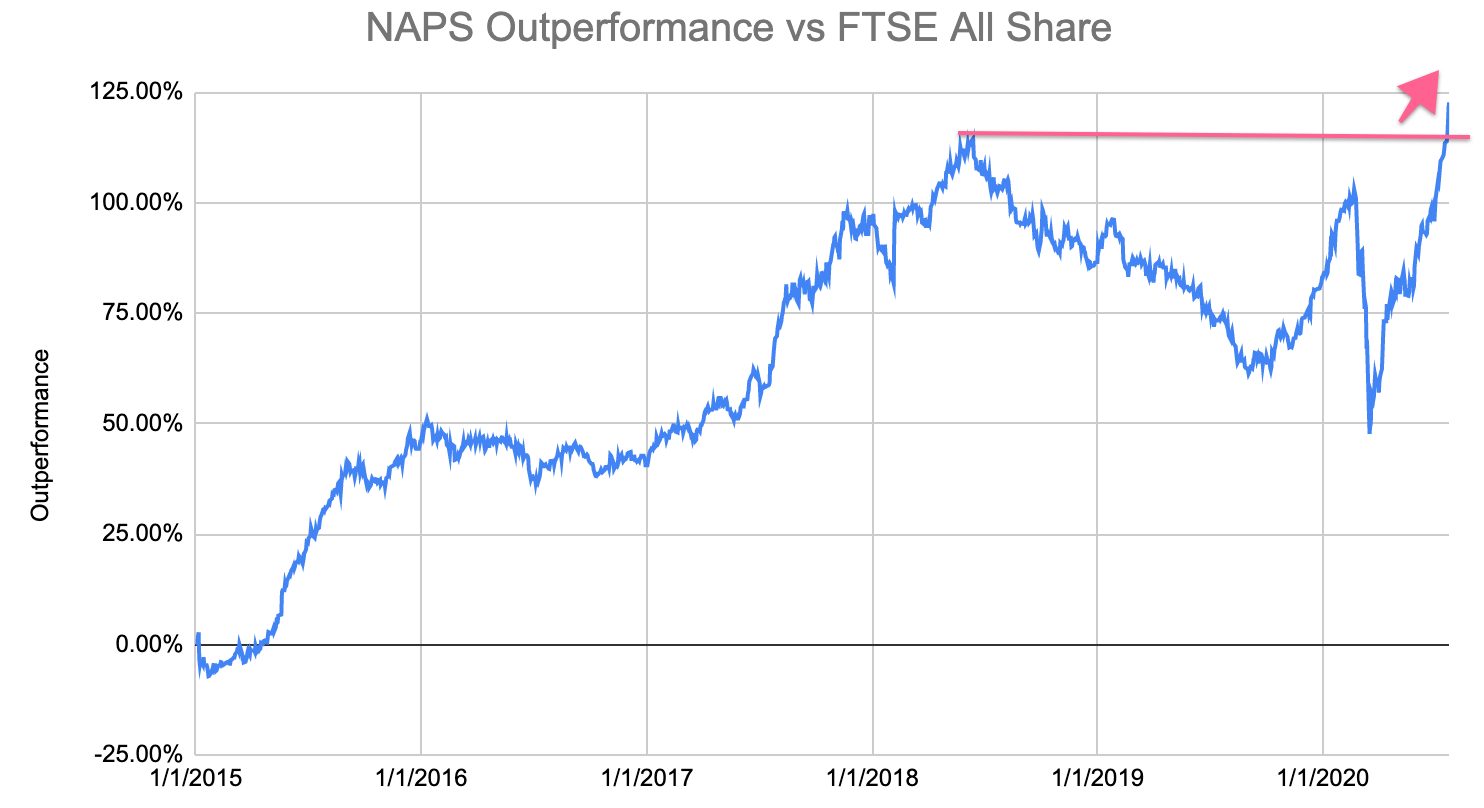
I couldn't help but subtract the FTSE All Share's performance from the NAPS to show how strongly the portfolio has been performing on a relative basis recently. As you can see below, the NAPS have broken out to a new relative high vs the FTSE All Share. Hopefully this momentum will continue towards new absolute highs in coming months - it's been a patient 2 year wait for that to happen.
Winners and Losers to June 30th
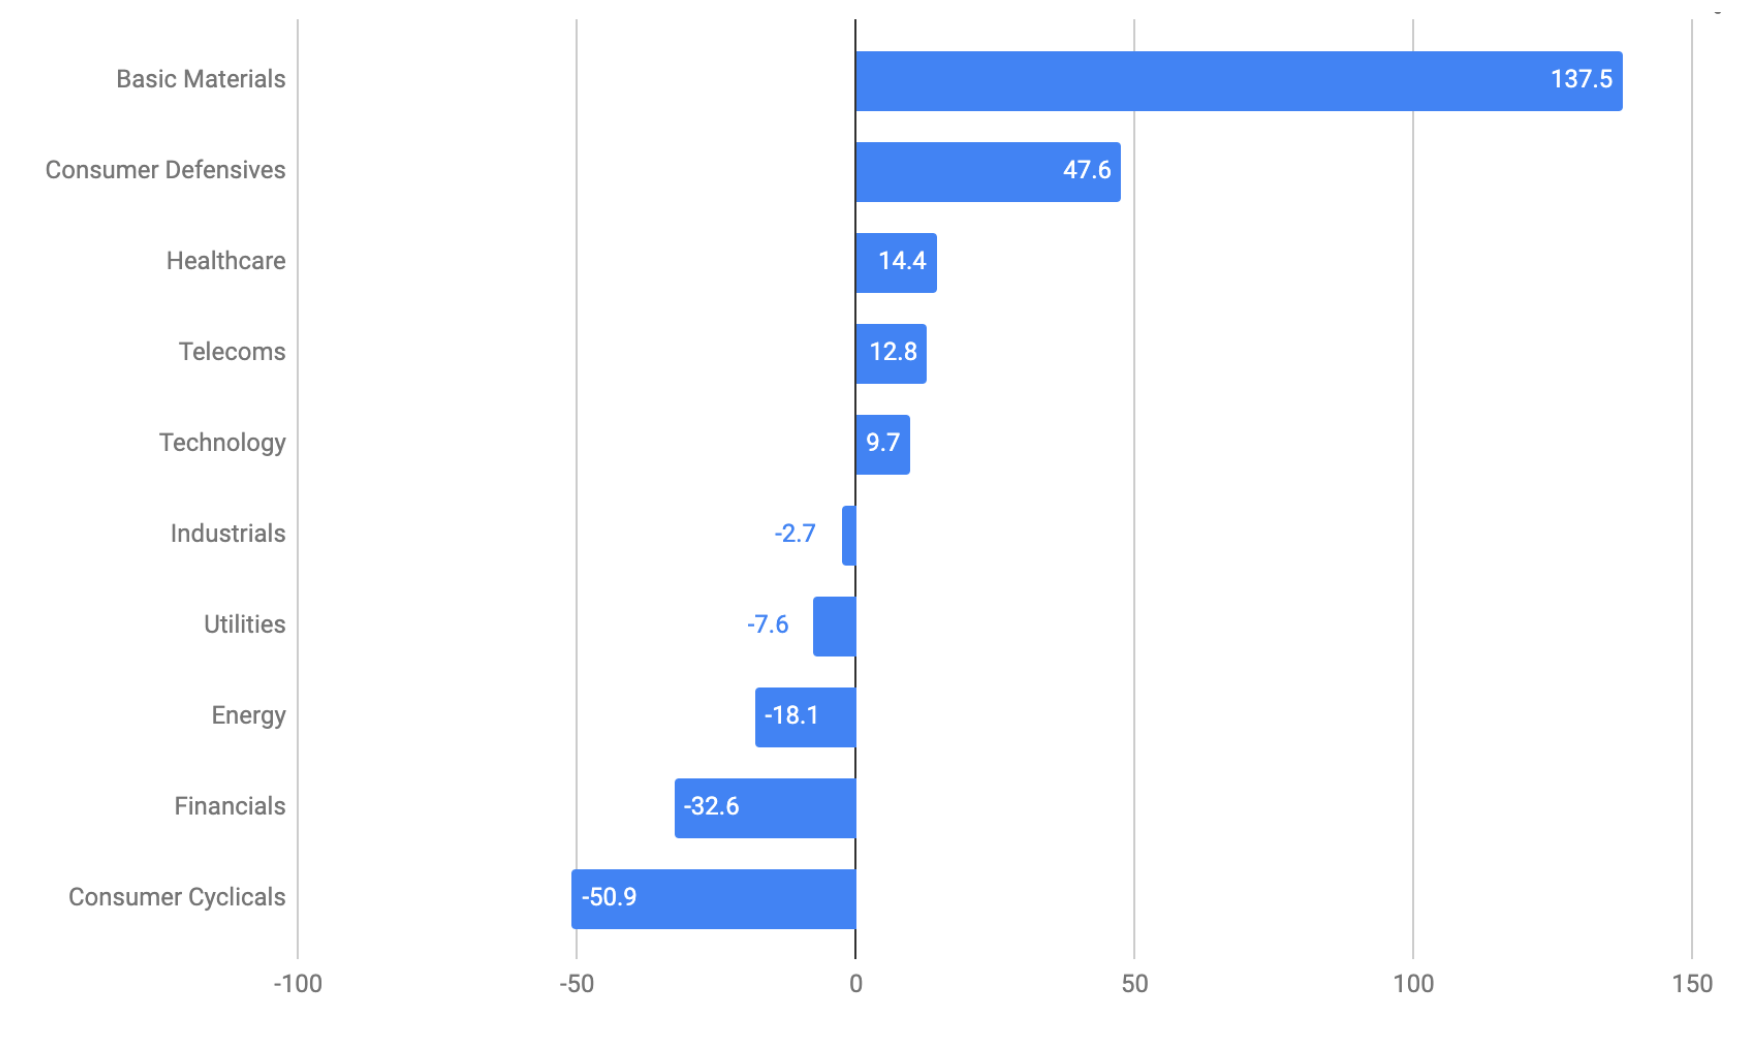
The good performance has been concentrated across a few themes, especially Gold, Food, Health and Gaming. Notably there has not been very strong breadth.
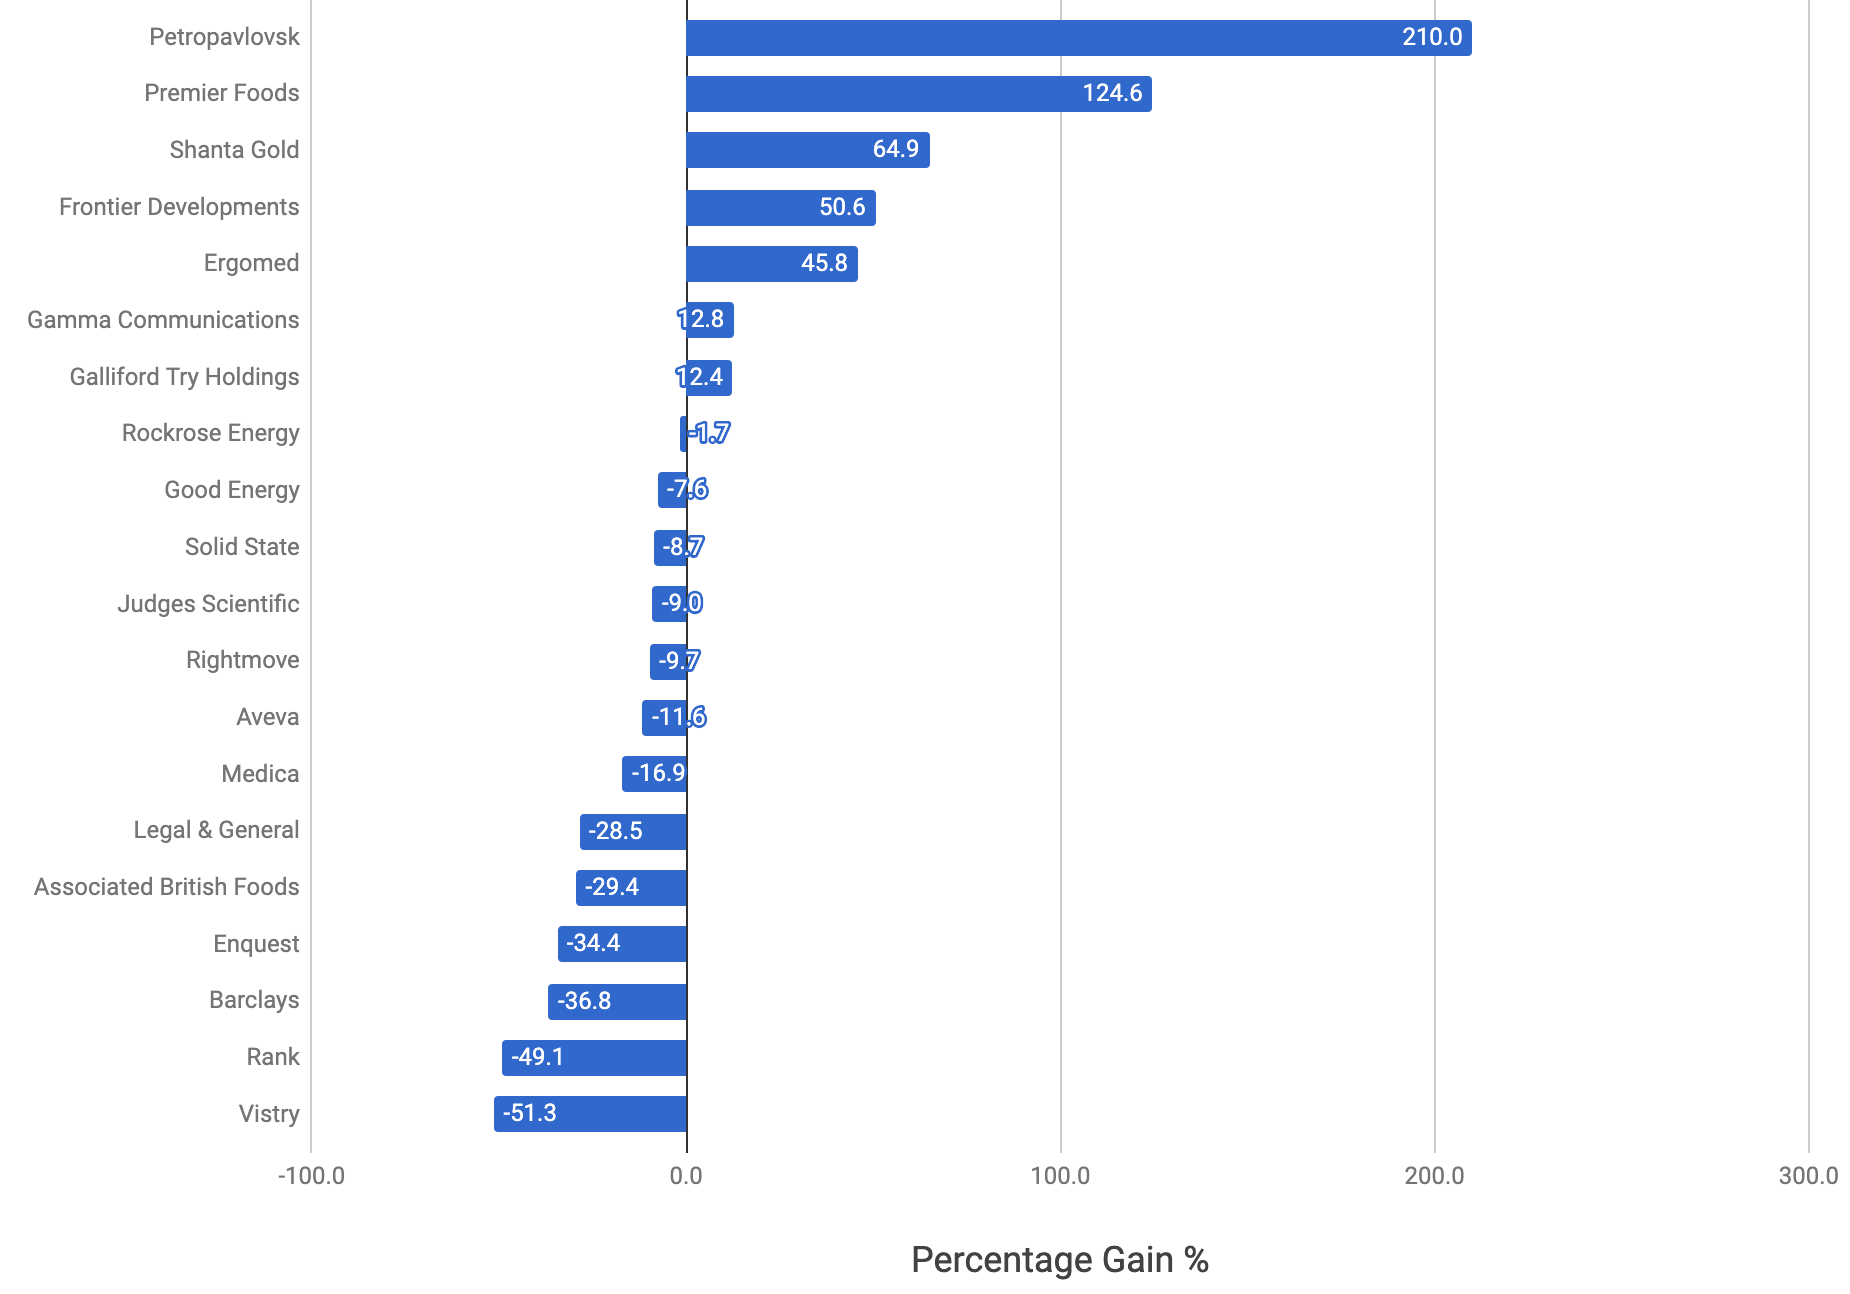
Petropavlovsk has been the stand out performer. It's scorched even further ahead this month and now stands 210% up for the year, while Shanta Gold is now up 65%. Jack has recently written an excellent article about Gold stocks with catalysts that highlights both of these names. Gold remains a terrific theme for investors, given the incredible stimulus provided to markets recently and the prospect of modern monetary theory becoming standard global policy. There could be a long way to run in precious metal stocks yet, and I hate to say it.
Premier Foods is another standout performer - now 125% up for the year. In clearing out supermarket shelves I couldn't help buying myself some Bird's Custard in case it really did become the end of the world. Premier Foods makes all these shelf-stables - like Ambrosia, Bisto, OXO, Paxo, Sharwood's, Bird's and Angel Delight etc etc - icky really, but Premier Foods looks like the perfect hedge for the Zombie Apocalypse.
Unsurprisingly the Energy and Cyclical stocks in the portfolio took a pasting in H1 as we stopped driving and buying anything we didn't need to survive. This sector performance chart really shows why diversification is so vital in a portfolio.
The benefits of not reading the news...
Stock markets are very volatile. In fact, they are far more volatile than they really should be even theoretically. Occasionally the market just scares itself to death. It certainly did that in March, perhaps justifiably. I thought it might even go lower... perhaps it will in future. Who really knows.
What I do know is that if you look at your portfolio, and read the news too often you are likely to end up less invested, and earn less returns from equities over the long run.
There have been many studies in the academic literature that illustrate this and explain it. Generally the researchers run an experiment as follows:
- Take a group of students or traders, and split them in half.
- Give them a certain amount of capital to invest.
- Show half of them news and prices every hour/day, show the rest of them news and prices rarely every month/year.
- Monitor their investment performance.
The results are always amazing, if predictable. Those that receive less frequent information on news & prices end up investing anywhere between 30%-80% more in riskier assets like equities. As the return expectation is higher for equities, they end up outperforming by a very large margin.
Behavioural Economist Richard Thaler has done some of the best work on this idea. He conjured the term "Myopic Loss Aversion" to explain this prevalent behaviour. There is even evidence that the entire reason why equities outperform in the long run is because investors tend to over-optimise for the short term by over-protecting their capital in the face of volatility.
In his book Misbehaving he wrote:
"Whenever anyone asks me for investment advice, I tell them to buy a diversified portfolio heavily tilted toward stocks, especially if they are young, and then scrupulously avoid reading anything in the newspaper aside from the sports section. Crossword puzzles are acceptable, but watching cable financial news networks is strictly forbidden."
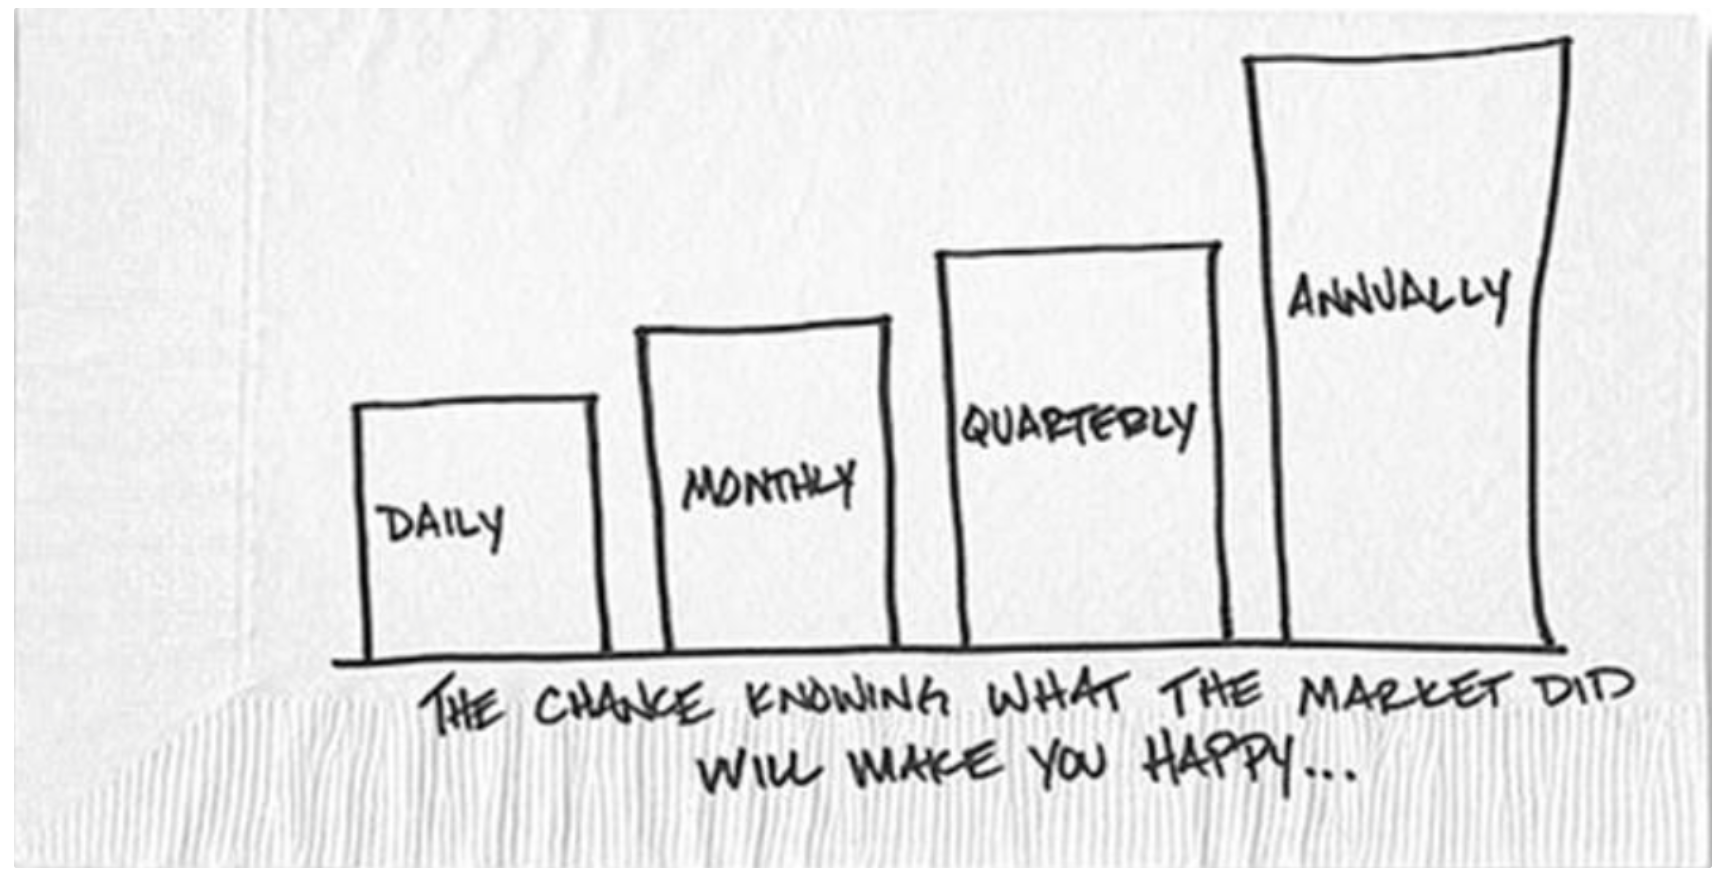
Carl Richards of The Behaviour Gap has done a nice sketch to illustrate the probability that looking at the market, and your portfolio, will make you happy.
Why not, as part of your summer reading, delete those news apps, and have a read of Rolf Dobelli's excellent, short manifesto instead - Stop Reading the News.
A change is as good as a rest...
While I'd love to pretend that I don't read the news and not impacted by it... I'm just as weak as the rest of us. I've tried deleting every news app, I've read Dobelli, I've read Digital Minimalism... but the news creeps back in. But what I do try to do is let the news influence long term strategy rather than short term positions.
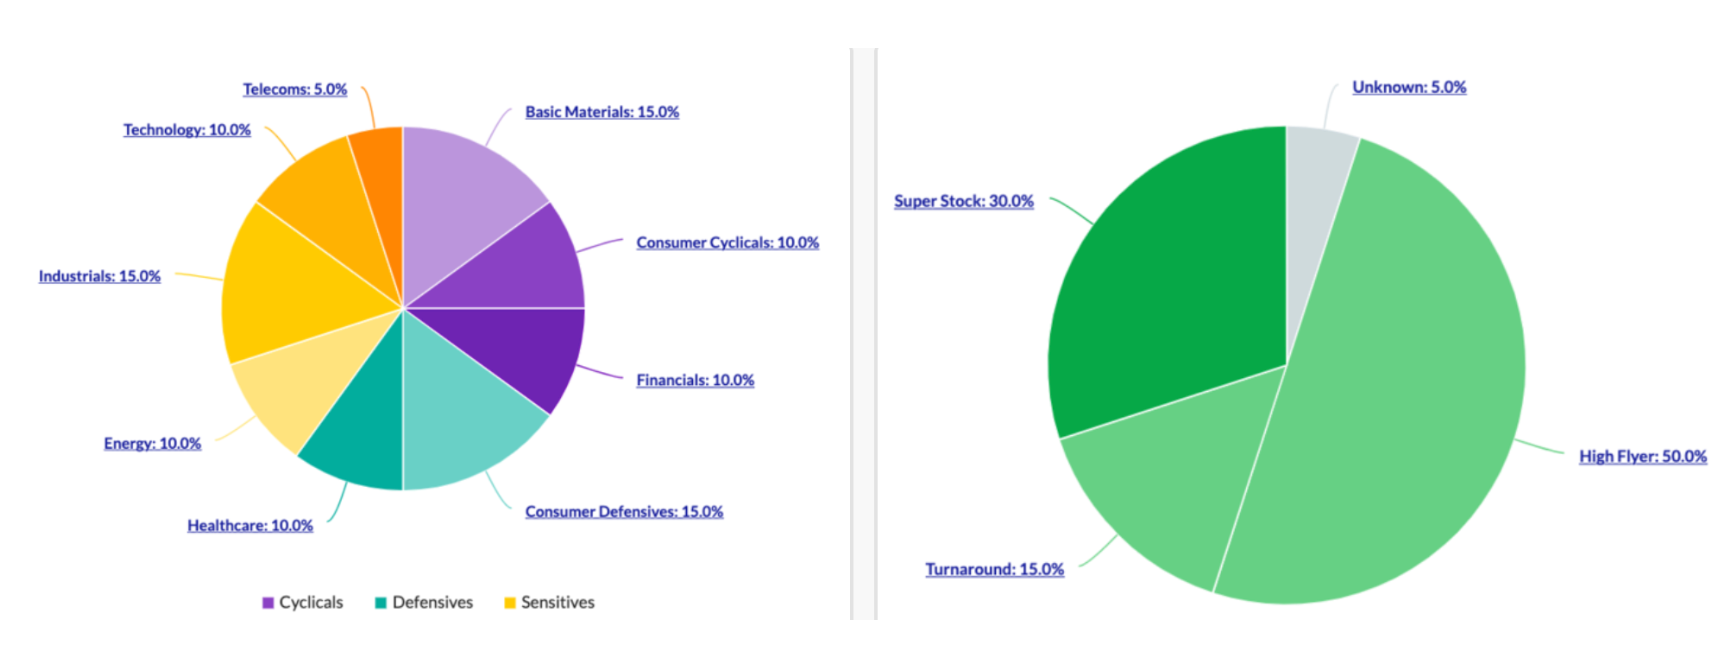
Many will know that I changed the NAPS strategy at the New Year mark. After five years of running the portfolio using a blended QVM (Quality + Value + Momentum) approach , I pivoted the whole strategy towards half High Flyers (that ignore V and focus on the QM rank) and half Turnarounds (that ignore Q and focus on the VM Rank).
At the tail end of a long bull market, I knew it was risky as the portfolio would be more momentum oriented, and also more full of adventurous and speculative risk ratings. But I hoped it would be more robust as the pure QVM approach was becoming rather full of tired cyclical names that I was sure were overdue a rest.
This change got a fair amount of criticism. People said I was introducing my own biases to the selection process. They were right, but the change has delivered results. The old QVM Portfolio would have fallen 15.7% at the half year mark, outperforming the FTSE All Share by a mere 3.04%. The new portfolio has dramatically outperformed.
I will be sticking with this new strategy for the NAPS - not only because it's performed better this year, but because it aligns more with my own research interests. There are some highly profound changes happening in the world economy, and a blended QM and VM approach may be more fruitful for the coming markets.
My reasoning is that the economy is shifting dramatically right now.
- There's a surge towards digital growth stocks, especially those that have benefited and look to benefit further from social distancing policies and the digital economy. QM/High Flyers are a good proxy for the 'growth' stock sector as whole for systematic investors, and these trends are likely to persist for some time. Anyone who wants to take the red pill and understand the profound shift that's happening in the valuations of platform digital businesses should read Geoff Yamane's work. I will try to summarise in layman terms in a future article.
- The corollary of this is that value stocks are getting more beaten down than ever. I've been reading a lot of Dan Rasmussen's work, which shows that small cap value is as cheap as it's been in almost 20 years relative to growth stocks. I do believe beaten down value stocks are going to see a resurgence in coming years. Gervais Williams convinced me last year at Mello that the UK small cap sector is full of resilient, profitable value stocks that are well placed to benefit from a capital reallocation away from punchy late cycle growth valuations. So having a strong weighting towards VM provides good diversification. As we've seen, owning just one powerful turnaround stock (such as Petropavlovsk) can dominate a portfolio's returns for an entire year.
As a systematic or discretionary investor, you have to keep testing your thesis. Yes, I will always be a factor investor, but that doesn't mean I should blindly follow the data regardless of the economy. The economy is in a more tumultuous state than it's ever been, there is huge internal flux in the markets as it searches for new leadership. What I want to do is choose the factors that I think are most likely to be resilient, without giving up the chance of outperformance. I believe VM & QM is a sound way forward.
The half year SNAPS selections
Every half year I re-run the NAPS process to create the Semi-Year NAPS - or SNAPS portfolio. Please note that the selections below were made as of July 1st, using the final data from the end of the first half of the year. They have been selected entirely systematically. Half of the stocks are high QM, and half are high VM. They have been chosen according to the rules laid out at the start of the year. You can obviously use the tools on the site to come up with a more timely list as of today's date. I do apologise for this article being slow to publish - it's been a busy July for me unfortunately.
| Ticker | Name | Mkt Cap | QM | VM | StockRank | Sector |
|---|---|---|---|---|---|---|
| CEY | Centamin | 2,294.2 | 98 | 84 | 95 | Basic Materials |
| CSN | Chesnara | 420.2 | 34 | 94 | 65 | Financials |
| EMIS | Emis | 649.3 | 91 | 44 | 78 | Healthcare |
| ERGO | Ergomed | 277.0 | 99 | 66 | 86 | Healthcare |
| GFRD | Galliford Try Holdings | 113.1 | 61 | 94 | 89 | Industrials |
| HFD | Halfords | 296.3 | 65 | 92 | 87 | Consumer Cyclicals |
| IGG | Ig Group | 2,754.7 | 96 | 89 | 95 | Financials |
| KAZ | Kaz Minerals | 2,562.5 | 86 | 97 | 92 | Basic Materials |
| KLR | Keller | 446.3 | 83 | 95 | 97 | Industrials |
| WINE | Naked Wines | 295.9 | 97 | 76 | 90 | Consumer Defensives |
| POLY | Polymetal International | 8,516.0 | 98 | 70 | 90 | Basic Materials |
| PFD | Premier Foods | 721.0 | 83 | 97 | 94 | Consumer Defensives |
| AGRO | Ros Agro | 936.7 | 92 | 99 | 98 | Consumer Defensives |
| SQZ | Serica Energy | 316.2 | 93 | 99 | 99 | Energy |
| SPT | Spirent Communications | 1,556.9 | 99 | 74 | 90 | Technology |
| TM17 | Team17 | 808.6 | 99 | 61 | 85 | Technology |
| XPP | Xp Power | 719.1 | 97 | 73 | 87 | Industrials |
| YCA | Yellow Cake | 198.0 | 70 | 86 | 59 | Energy |
| YOU | Yougov | 856.4 | 99 | 59 | 84 | Consumer Cyclicals |
| ZEG | Zegona Communications | 254.3 | 64 | 98 | 75 | Telecoms |
Thanks to Ben Hobson and the team for putting the write ups of the following stocks together.
Consumer Cyclicals
Halfords
Sector: Consumer Cyclicals / Specialty Retailers
Market Cap: £312.6m
Stock Rank: 98
VM Rank: 99
Risk/Size/Style: Speculative, Small Cap, Super Stock
Anecdotally, it sounds like bike shops have found themselves in very strong demand during the Coronavirus lockdown. The question now is whether that will continue as the world starts to settle into new routines.
On paper, the move towards more cycling and more staycations (in tents rather than hotels) would suit a retail chain like Halfords. But of course, while the group has been open during the lockdown, retail life is far from normal. After a couple of years of negative price momentum, shares in Halfords picked up in June - catapulting it to a potentially strong value + momentum ‘turnaround’ play.
In its full year results in early July, Halfords’ chief executive Graham Stapleton, said: “Despite the wider uncertainty caused by Covid-19, we remain confident in the long-term prospects for Halfords given the strong macro tailwinds within our market-leading Motoring and Cycling businesses.”
YouGov
Sector: Consumer Cyclicals / Media & PublishingMarket Cap: £813.2m
Stock Rank: 98
QM Rank: 99
Risk/Size/Style: Adventurous, Mid Cap, High Flyer
YouGov is a classic High Flyer: very expensive across some traditional valuation metrics, but with quality ratios to die for and a hard to replicate brand servicing a global niche. The company is busy using its suite of products to capitalise on a global opportunity - it recently signed a strategic multi-year contract with a large international financial services company based in Germany, and it is expanding its panel to include Austria, Brazil, Switzerland, and Turkey.
With a Value Rank of just 7 and an eye-watering PE ratio of 38.2 times, YouGov is all about the Quality and Momentum Ranks. The share price just keeps going up, so maybe it’s time to bite the bullet and jump on board.
The group reassures in its latest statement, saying: “Trading during the second half of our financial year has started positively and is in line with Board expectations for the full year. We are yet to see any material impact to our business from the global outbreak of COVID-19 and we continue to monitor the situation closely.”
Industrials
Galliford Try
Sector: Industrials / Construction & Engineering
Market Cap: £130.3m
Stock Rank: 95
Risk/Size/Style: Speculative, Small Cap, Super Stock
Galliford Try joined the NAPS at the start of the year just as it was wrapping up a deal to sell its home building business to Bovis Homes (now Vistry Group). What was a mid-cap is now a small-cap but Galliford retains its strong Stock Rank - helped by a very strong Value Rank - and rolls over into the SNAPS portfolio.
On a six month basis, the stock has underperformed the general market, presumably over concerns about the impact of Covid-19 on its operations. In a trading statement during July, the company said it was re-doubling efforts to cut costs and conserve cash to account for the impact of the virus and the group’s future business requirements.
Bill Hocking, Galliford’s chief executive, said: “Going forward we are well placed to benefit from the planned spending in our chosen sectors and to support the rebuilding of the economy...”
Keller
Sector: Consumer Cyclicals / Media & Publishing
Market Cap: £454.94m, Stock Rank: 97
QM Rank: 96
Risk/Size/Style: Speculative, Mid Cap, Super Stock
Keller is a low margin, low multiple “geotechnical specialist contractor” - it lays the foundations for others to build on. The company says it has a 5% share of a $55bn global market but is still one its largest players. That suggests a fragmented global market ripe for the taking.
Industry trends all play to its strengths - urbanisation, more use of brownfield sites, infrastructure renewal and expansion, increasing demand for complete solutions and increasing technical complexity.
The group is surprisingly upbeat in its most recent statement, saying: “overall trading for the first quarter was better than our expectations, and materially better than the prior year. This was despite a deterioration in activity during the second half of March as the impacts of COVID-19 were felt across the group… Trading during the second quarter to date has been resilient, with the impact of COVID-19 being less significant on the group overall than first anticipated.”
XP Power
Sector: Industrials / Machinery, Equipment & Components
Market Cap: £703.5m
Stock Rank: 87
QM Rank: 98
Risk/Size/Style: Adventurous, Mid Cap, High Flyer
XP Power specialises in industrial power supply systems and components, and has offices around the world. Up until 2018, this FTSE 250 stock had been on a solid five-year run as earnings grew steadily. But as macro headwinds dragged on the performance, investors got spooked and the shares fell sharply through 2018.
XP’s shares have re-found their momentum over the past 18 months and they recovered quickly from the downturn in March. The company’s solid quality traits suggest that any financial and operational setbacks caused by coronavirus may be short-lived.
In a trading update in June, the company said: “Our strong order book gives good near-term visibility, but high levels of economic uncertainty and general market volatility continue to provide a wide range of potential outcomes for 2020. Longer term, the Board believes XP Power to be very well positioned to grow ahead of its end markets supported by strong cash generation and a robust balance sheet.”
Financials
Chesnara
Sector: Financials / Insurance
Market Cap: £412.7m
Stock Rank: 73
VM Rank: 97
Style / RiskRating: Adventurous, Mid Cap, Turnaround
Chesnara is in the business of managing life and pension policy books, both in the UK and parts of Europe. Its growth strategy is to buy up additional portfolios as well as writing new business itself. The watchword here is dependability.
Although ’Economic Value’ will take a hit, Chesnara is a reasonably predictable business that has proved resilient to Coronavirus. Last year it generated lots of cash and kept up the momentum as an impressive dividend payer. The current yield stands at 7.75% and the payout has enjoyed modest single figure growth every year for several years. Based on the StockRanks, Chesnara shares look potentially well valued and have reasonable momentum behind them.
In its full year results in April, Chesnara’s chief executive John Deane, said: SHistorical investment decisions have given us a balanced risk profile as a business. Prudent, yet progressive, historical dividend payments, a low gearing ratio (11%) and a keen focus on operational resilience have resulted in the business being able to cope well with the challenges of Covid-19 and provide our customers, investors and other stakeholders with a strongly capitalised business that provides stability and security in these uncertain times.”
IG Group
Sector: Financials / Investment Banking & Investment Services
Market Cap: £3.09bn
Stock Rank: 94
VM Rank: 98
Style / RiskRating: Adventurous, Large Cap, High Flyer
When it comes to financials with high exposure to quality and momentum, it was no surprise to find IG Group, CMC Markets and Plus500 all ranking high in the current environment. CMC edged it on the scores but IG gave us a chance to add some large-cap diversification to the mix. In the end, we opted for the spread betting pioneer.
Shares in these trading platforms have a habit of outperforming when volatility sweeps through markets. With traders of all experience gravitating to wide swings in prices, IG has done very well. The share price dipped on the full year results, but it remains a high margin, high profitability business.
In its full year results, issued towards the end of July, IG said pre-tax profits had increased by 52% to £295.9 million. Chief executive June Felix said: “In FY20, we experienced growing client demand across the world for IG's products and services even prior to the exceptional period in Q4, and delivered record results.”
Energy
Yellow Cake
Sector: Energy / Uranium
Market Cap: £191.41m
Stock Rank: 78
VM Rank: 98
Risk/Size/Style: Balanced, Small Cap, Turnaround
Yellow Cake is a play on the price of uranium, without the exploration, development, mining or processing risks usually associated with an operating company. Founded and established by Bacchus Capital Advisers, the company purchases and holds uranium oxide through its long-term contract with Kazatomprom - the largest, and one of the lowest cost, producers of uranium globally.
A Balanced Turnaround stock with a VM Rank of 98, Yellow Cake looks like an unusual mix that could play a useful role as part of a diversified portfolio.
Management sounded upbeat in the latest results, with CEO Andre Liebenberg commenting: “The uranium spot price continued to rise during the year, as the effects of constrained supply, exacerbated by the impacts of Covid-19, and steady demand work in the commodity's favour. Given the ongoing NAV discount reflected in our share price, we have decided to launch a more substantive share buyback programme, and aim to capitalise on our supply agreement with Kazatomprom at the appropriate time.”
Serica Energy
Sector: Energy / Uranium
Market Cap: £281.97m
Stock Rank: 98
VM Rank: 98
Risk/Size/Style: Highly Speculative, Small Cap, Super Stock
Serica is an independent upstream oil and gas company with operations centred on the UK North Sea. As of 2020, Serica has over £100m in cash, no debt and limited decommissioning liabilities, with natural gas making up over 80% of its production.
As the SNAPS’ sole Highly Speculative pick, Serica is not without risk. It’s hard to know where the oil price goes from here but a Value Rank of 86 provides some reassurance while we wait for a recovery. Indeed with its robust financial health, increased production levels and reduced operating costs, the company might even be able to take advantage of strategic opportunities as others struggle. Serica has strong ranks across the board meaning it comfortably qualifies for Super Stock status.
In the group’s 2019 Annual Report, CEO Mitch Flegg commented: “2019 was a year of exceptionally strong performance in an increasingly challenging environment. We have now established Serica as one of the leading UKCS operators, as clearly demonstrated by increased production and reduced operating costs.”
Basic Materials
Kaz Minerals
Sector: Basic Materials / Metals & Mining
Market Cap: £2.29bn
Stock Rank: 95
VM Rank: 97
Risk/Size/Style: Speculative, Mid Cap, Super Stock
Kaz Minerals is one of the largest copper producers in the world. With operations in Kazakhstan, this low cost miner has its sights set on becoming the leading natural resources company in Central Asia. It certainly looks to be growing at pace, having increased its copper output from 81 kilo tons in 2015 to 311kt as of 2019. The group has also ramped up gold production from 35koz to 201koz over that same period of time.
At less than ten times forecast earnings, high margins and returns on capital, and a healthy outlook for copper, Kaz’s shares could offer attractive upside potential from current levels.
In the group’s most recent trading update back in April Andrew Southam, CEO, said of working through the lockdown: “The measures we have taken have enabled us to deliver a strong quarter of production, with copper and gold output respectively 7% and 28% higher versus the prior year period, and to maintain our full year guidance.”
Centamin
Sector: Basic Materials / Metals & Mining
Market Cap: £2.08bn, Stock Rank: 96
QM Rank: 99
Risk/Size/Style: Speculative, Mid Cap, High Flyer
Centamin owns and operates a Top 10 low cost, long life asset in Sukari, which has a life of mine greater than 15 years and a cost profile in the lowest half of its cost curve. The group appears conservatively run, with strong liquidity ratios and a net cash position. It also has a high quality institutional shareholder base and large free float.
It’s a proven, profitable gold miner backed up by great F and Z-Scores, strong share price momentum, and solid dividend payments. It qualifies for both the Value Momentum and Quality Income screens, suggesting an attractive mix of factors and dividend payments.
In a Q2 2020 update in July, the Centamin’s CEO Martin Horgan said: "Today's results reflect a good first half performance for 2020… Whilst we continue to actively manage the potential future impacts of Covid-19, we remain confident we are on track to meet guidance and have narrowed the production range to 510,000 to 525,000 ounces and kept cost guidance unchanged.”
Polymetal
Sector: Basic Materials / Metals & Mining
Market Cap: £7.4bn, Stock Rank: 91
QM Rank: 99
Risk/Size/Style: Balanced, Large Cap, High Flyer
Polymetal is a top 10 global gold producer with nine gold and silver mines and three development projects across Russia and Kazakhstan. Despite its large size and deep coverage (followed by 19 brokers), Polymetal remains modestly valued on a forecast PE basis (10x) with a PEG of just 0.4 even though it has benefitted from frequent earnings forecast upgrades over the past year. It also qualifies for the Quality Income screen - a reassuring sign for a miner.
Polymetal looks to have so far emerged from the Covid-19 disruption unscathed. In a Q2 update in July, the company reported that revenue was up by 30% y-o-y to US$ 641 million on the back of higher gold prices and sales volumes.
Vitaly Nesis, Group CEO of Polymetal, said: “Q2 saw a continued steady performance of the group.” We have been taking a range of measures aimed at protecting our employees and contractors in light of the COVID-19 pandemic, while allowing our operations and projects to proceed without interruptions or delays to date.”
Consumer Defensives
Ros Agro
Sector: Consumer Defensives / Food & Tobacco
Market Cap: £924.6m
Stock Rank: 98
QM Rank: 99
Style / RiskRating: Balanced, Mid Cap, Super Stock
This Russian agriculture business has major operations involved in the production of sugar, pork, crops, oil and fats. It floated in London in 2011 and promptly saw its price halve within a year. Since then, things have improved but it obviously brings some slightly unusual considerations.
For a start, the Russian rouble nose-dived as the price of oil slumped earlier this year. But on the upside, business has been booming in some areas of the business as consumer demand surged on the back of the coronavirus pandemic.
Unsurprisingly this is on a single figure multiple of 7 times earnings. And while the price has drifted over the past couple of years, analysts have upped their 2020 EPS forecasts from 13.95 rubles to 17.44 over the past couple of months. So this is a somewhat off-piste move into Russian agriculture.
In its Q1 Results in May, Maxim Basov, the group CEO, said “Q1 2020 showed strong performance in terms of sales and adjusted EBITDA. All business divisions except the Agriculture Segment demonstrated sales growth.”
Premier Foods
Sector: Consumer Defensives / Food & Tobacco
Market Cap: £676.9m
Stock Rank: 96
VM Rank: 99
Style / RiskRating: Adventurous, Mid Cap, Super Stock
Premier Foods is the owner of a stable of well known British food brands including Mr. Kipling, Bisto, Batchelors, and Ambrosia. It also has the license to make and sell Cadbury’s Mini Rolls. For years, this company has been weighed down by large debt levels and struggling pension funds - but things appear to be changing.
Net debt is tumbling and is now down from more than 5x EBITDA a couple of years ago to less than 3x. Meanwhile the group has alerted the market to a ‘landmark’ pensions agreement that will see it reduce the overall size of its schemes, while at the same time increasing funding levels and reducing administration costs. This not only makes it a safer company - it means free cash flow should increase and the group will have more firepower to spend on marketing its neglected brands.
In its FY20 Preliminary Results, the team said: “Revenues in the first quarter of FY20/21 are expected to be approximately 20% ahead of the same quarter a year ago reflecting continued strong demand for the Group's product ranges, particularly in our Grocery business. Consequently, we expect to exceed current expectations for FY20/21 Revenue and Trading profit despite incurring some additional operating costs in our supply chain.”
Naked Wines
Sector: Consumer Defensives / Food & Drug Retailing
Market Cap: £309.7m
Stock Rank: 90
QM Rank: 97
Style / RiskRating: Adventurous, Small Cap, High Flyer
Last summer, Majestic Wine (as it was then known), sold its bricks and mortar retail business for £95m and pivoted to being an online-only business under the Naked Wines brand. Faced with a pandemic, this is the sort of business you might think would do well - and there are signs that it is.
The twist is that Naked Wines funds and sources wines from independent makers (and it encourages customers to do the same). By doing that it’s trying to build an online community of wine lovers, who are also loyal customers. The catch is that it’s not profitable yet.
Unusually, Naked Wines ranks highly for its quality traits despite losing money. That’s partly because the rank uses long term averages and is still accounting for the old Majestic numbers. As it stands the new set-up, while growing quickly at home and in the US, isn’t quite there. Even so, the shares have doubled from 200p to 400p since March and the financial picture is improving.
In a trading update in late July, the company said: The group continues to trade strongly, with total sales in June +67% vs the prior year, bringing sales growth for the first quarter to +77%. The Board continues to believe that Naked is ideally positioned to be a long-term winner from the inflection in consumer demand for online wine as a result of the Covid-19 pandemic.
Healthcare
Ergomed
Sector: Healthcare / Biotechnology & Medical Research
Market Cap: £228.5m
Stock Rank: 88
QM Rank: 99
Style / RiskRating: Adventurous, Small Cap, High Flyer
Ergomed is a service provider to the pharmaceutical industry, with a focus on making sure that new treatments don’t have adverse effects and operating drug trials. It specialises in oncology, neurology and immunology, and the development of orphan drugs. It was brought into the NAPS folio at the start of the year and retains its place.
Ergomed was previously involved in drug development but has pivoted in recent years to the much more profitable provision of services to other developers.
In a trading update in July, the company said: “Building on the robust performance reported at the beginning of the year, Ergomed had an excellent first half, with overall growth in revenue driven by continued demand for its services across the integrated business, despite the global Covid-19 pandemic. Ergomed now expects EBITDA for the year ending 31 December 2020 to be materially ahead of current market expectations.”
EMIS
Sector: Healthcare / Healthcare Equipment & Supplies
Market Cap: £668.2m
Stock Rank: 88
QM Rank: 97
Style / RiskRating: Balanced, Mid Cap, High Flyer
EMIS first appeared on the NAPS radar back in 2019 and was one of the strongest performers in the portfolio during the first half of last year. Competition is tough in this sector and it was displaced by Medica in this year’s folio but now makes it back into the SNAPS.
EMIS is behind software that is used in pharmacies, GP surgeries and hospitals to help manage and share information. New businesses sales look likely to be down slightly this year but the most recent reports suggest that revenues have remained intact and EMIS is ploughing ahead with growth plans rather than furloughing staff and cost cutting. It’s showing signs of being an increasingly wood quality business.
In a July trading update, the company said that trading for the half year has been in line with the board's expectations, despite uncertainty due to the Covid-19 crisis, albeit revenue was marginally behind the comparative period last year. Although there continues to be some uncertainty regarding the timing of new sales delivery, the Board's expectations for the full year remain unchanged.”
Technology
Team17
Sector: Technology / Software & IT Services
Market Cap: £735.9m
Stock Rank: 86
QM Rank: 99
Style / RiskRating: Speculative, Mid Cap, High Flyer
Team17 is a UK-based computer game developer with a portfolio of over 100 games, including the iconic “Worms” franchise. The group’s CEO, Debbie Bestwick, has a sizable 22% stake in the company.
Team17 have been a stellar performer over the past six months, riding a wave of investor enthusiasm for the gaming sector. The shares have turned out to be one of the big winners of the coronavirus lockdown. Combined with some solid quality traits, the stock is now one of the highest ranked QM shares in the market.
In a pre-close trading update in June, the company said: “Despite the challenges generated by C-19 we are delighted with an excellent start to FY2020 and, as previously announced, we have a solid pipeline of new releases weighted towards the second half of 2020. We have more games in development across our label than at any time in our history, including owned IP and are engaging with more partners seeking to have their games be part of our label and continue to see more new gamers playing our games and franchises during C-19.”
Spirent Communications
Sector: Technology / Communications & Networking
Market Cap: £1.55bn
Stock Rank: 91
QM Rank: 99
Style / RiskRating: Adventurous, Mid Cap, High Flyer
Spirent Communications has appeared a couple of times in the SNAPS portfolio in recent years. It is a communications technology company that focuses on connected devices, networks & security and lifecycle service assurance.
This is a solid High Flyer stock, which rebounded strongly from the market crash in March and has seen consistent earnings forecasts upgrades this year. It has a robust growth track record, and it looks like it won’t be suffering adverse effects from Covid-19.
In a Q1 update in April, the company said: “We delivered strong results in the quarter, with order intake showing good growth, revenue was up 12 per cent, and we drove robust profit growth compared to the same period in 2019. We benefited from our strong opening orderbook and we have continued to build momentum into the second quarter.”
Telecoms
Zegona Communications
Sector: Telecoms / Telecommunication Services
Market Cap: £257.7m
Stock Rank: 74
VM Rank: 97
Risk/Size/Style: Conservative, Small Cap, Turnaround
Zegona was established in 2015 with the aim of investing in businesses in the European TMT sector and improving their performance to deliver attractive shareholder returns. The group is led by former Virgin Media executives Eamonn O'Hare and Robert Samuelson. Its main interest is currently a 20%-plus stake in Spanish quoted telecoms group Euskaltel S.A., which is this year planning to expand rapidly using the Virgin brand.
In response to Euskaltel’s Q2 update in July, Eamonn O'Hare, Zegona's Chairman and CEO of Zegona, said: “These results demonstrate the excellent progress being made by the new management team at Euskaltel, combining a focus on operating efficiency within the existing business with driving significant growth through National Expansion under the Virgin brand.”
Disclaimer
This is not financial advice. Our content is intended to be used and must be used for information and education purposes only. Please read our disclaimer and terms and conditions to understand our obligations.
35 comments
I have a basic question based on the revised method of splitting the portfolio equally across QM & VM and the sectors. Am I correct in assuming that you could have two stocks from one sector in either the QM or VM 'bucket'? Or do you select the highest QM rated financial and then the highest rated VM financial, for example. The latter method would mean lower rated stocks if you have to look way down the ranking list to find a technology company in the value category, say. I guess the first method is slightly more complicated but would offer higher rated stocks. Put simply, do either the QM/VM categories have to have 10 sectors in each, i.e. 10 different sectors in QM and 10 different sectors in VM?
Hi Ed and the team,
Fasinating article.
The chart here is an amazing illustration.
Have you ever thought about adding in a couple other fields to the chart ( see screen shot)
Right now, this chart while an amazing chart, is hampered by the fact that buying all the +90 SR shares is tough. So that introduces the risk of picking the 30% of those that fall.
Obviously I know you can do this in the screens, but the screens dont show the overall "performace" of the screen. Adding in a couple of the other numbers in the data base into this chart would be very powerful.
Hi Ed,
I appreciate you don't include transaction costs and dividends but I think your % gain numbers are on the high side. This maybe because there may have been a bit of a mix up with regard to cut off dates. For example the 200%+ gain in Petropavlovsk (LON:POG) is up to 25th July (as it says in your text) whereas the performance to 30th June was good but not that good (about 104%)! From the end of June to 25th July was a pretty good period for markets (especially gold) as concerns re Covid-19 were, albeit temporarily, ebbing so if the other gains and losses are to July 25th then the graphic is not measuring the performance over the normal 6 month period you use for the NAPS
I model NAPS portfolio on a six month cycle consistent with your selections. This process creates a virtual portfolio valued at approximately £50,000 with c.£2,500 in each holding. Commission (at AJ Bell's rate of £9.95) and Stamp Duty where appropriate are included in the overall cost of the portfolio. This is then compared with the valuation at June 30th including any dividends received in the holding period. The share prices are taken from the closing prices on 2 January and 30 June as indicated on Stockopedia Charts (I accept there is a small element of approximation here and also you start your calculation from close of business 31 December). On this basis overall performance including costs and dividends was a negative 1% - pretty good vs. the market but not the 8% gain which I assume is to July 25th if the Petropavlovsk (LON:POG) comments reflect the other holdings too. Unfortunately I am not great with Excel graphics so have had to resort to a tabulation of my results as shown in the table below. Given that you are refreshing the portfolio as at July 2nd shouldn't this performance (or something close allowing for my inclusion of costs and dividends) be the appropriate one for the NAPS process or have I misunderstood your analysis? (Note: I haven't included Vistry in my analysis)
Yes - I had the performance at about -1% at the half year mark at 30th June. This is non controversial and is as illustrated by the date/performance crossover in the chart on that date.
There was no mix up on dates... I just didn’t manage to write the article till the 24th - so performance was reported as of that date.
Hi Ed,
Yes I can see that the date/performance crossover that chart implies something close to break-even - no controvesy intended! I missed that by focusing on the individual share price bar chart and misinterpreted the text heading as meaning that it was the gains to June 30th when you explain in the text that it was performance to the date of you writing the article (24th July). Fully clarified now - Thanks.
Hi Ed,
I should have added another interesting point. I adopted the same approach for your previous NAPS methodology (you identified these stocks in your January write up) and the top 20 most popular stocks from the Stockopedia stock picking competition. The 'old' NAPs methodology produced a return of -17.4% so it was a very good move to switch to the new system! The Stocko Top Picks was more successful returning a small loss of -1.5%.
Hi. I am new to the Naps portfolio, considering all my options.
I can see you mentioned that the performance between the old Naps and the new one is pretty bight.
What is the main difference between both?
Only the review at 6 months and rebalancing?
Thanks for your help?
He explains this in the article.
Old NAPS used all three of Quality, Value and Momentum stockranks and all picks were a strong blend of all three.
The new way creates two group, one with high QM and the other high VM. Hope this helps explain it.
Hi contiuk,
IGPJ described the difference between the developing approach to NAPS, but in your question I think you may have conflated the difference between NAPS (annually rebalanced) and SNAPS (half yearly rebalanced).
As you say you are new, if you are interested in how the approach has developed, it is probably worth reading through the whole history from the start; which you can find HERE
It will take you a while (!) but if the concept is of interest I would definitely recommend it as worthwhile.
Hi Guys,
Thank you both for the reply, I appreciate it.
I watched a webinar on the initial NAPS and then read the posts for the SNaPs but yes, I believe I got a bit confused.
There is so much information available on long term investing, it’s overwhelming.
I’m currently reading three books at the same time lol.
At this very moment I am half way through the Stockpedia book “How to make money in value stocks”, which I find a great summary and mix of several books together.
Anyway, I find Stockopedia a great platform to save me tonnes of time, but still not sure how to use to my favour all those screens.
I’ve been checking performance (UK only stocks); Piotrosky, the Zulu principle and Growth and a reasonable price seem the ones with higher return over 5 years and more consistently.
But then found the NAPS portfolio! Which it makes sense in terms of less hassle on choosing stocks and balancing a portfolio.
Sorry for the long text
Thanks again for the help. See you around here : )
Fantastic to see a real portfolio built on the back of NAPS and SNAPS. The suggestion that bid/offer spreads, transaction costs and dividends are all excluded from performance and therefore roughly balance out is a pretty fair one - in a normal year! But this year dividends are extremely hard to come by. So it is superb to see the real picture. Thanks for your time to post.
Thanks for the update. The results would seem to prove that one cannot cherry-pick stocks from the NAPS system as, to do so, could severely dent a person's performance as in H1/2020 more than half of the stocks are down over the period (not withstanding the Covid effect).
Just in relation to the write-up on Serica Energy (LON:SQZ) although its price tends to be affected by changes in the oil price the majority of the company's production is actually gas and not oil.
Wow! That’s what I call a V-shaped recovery!
I am jealous of that!
Thanks for sharing this, Ed, very informative.
Btw, what happened to Reach (LON:RCH) which you had selected for 2020? Did you swap it with Vistry (LON:VTY)?
Reach is in the portfolio & performance calculations. Vistry appeared when Galliford Try divested its housebuilding to Bovis in January... so there are 21 shares in the current NAPS set.
I'm not sure why it's not in the bar chart above - I delegated that task and it appears to have slipped off the diagram. I'll have it amended.
Does anybody know a UK stockbroker who trades Ros Agro?
Keller goes xd tomorrow
Thanks for this Ed, I’ve now bought into factor investing as it was outperforming my own picks. I have split my own portfolio into 3 sub portfolios based on stockrank, qm and vm with some other rules for diversification, balance sheet, stop losses, etc. Qm is outperforming the others at the moment.
QM has been doing best of all the ranks this year - our tracking of the QM Screen just tracks the top 25 candidates quarterly (rather than the entire top decile that the ranking charts do). It's about breakeven for the year.
https://www.stockopedia.com/screens/top-qm-rank-481634?view=5b616fcf6bc24
Many thanks for doing this detailed write up Ed, and congratulations on achieving spectacular results having successfully weathered recent events. You mention that you hope to discuss your disciplined methodology in more detail in the future; I for one, would find this most helpful.
Notwithstanding the need to digest news with a grain of salt, I think that it is widely regarded that 2 of the most reliable market bellwethers are the yield curve and the VIX. Have you considered using these measures to help adjust exposure to markets, and perhaps boost the portfolio's long-term performance yet further?
Really insightful, thanks for the great write up.
Hi Ed,
Regarding your comment:
"There could be a long way to run in precious metal stocks yet, and I hate to say it."
I recently read an interesting article which was backed up with charts showing a correlation (for the period from the late 1960s until the current date) between the amount of money printed by the USA government and the price of gold. So far this year I understand the Federal Bank has printed over $5 trillion of money. If the 50 year correlation continues beyond 2020, and the charts hold true and the analysts predictions are correct then this implies that gold will continue upwards from its current price of just under £1,500 per ounce to a new high somewhere in the region of around £3,000 per ounce. Obviously, I must stress this is just a prediction but it will be very interesting to see if the 50+ year correlation continues into the future.
I shall be watching the price of gold over the next few months / year(s) because I am long in Polymetal International (LON:POLY) Polymetal International, £PAN Pan African Resources, Centamin (LON:CEY) Centamin and Sylvania Platinum (LON:SLP) Sylvania Platinum.
An excellent article produced by you Ed. I always like to compare the shares which I personally hold with the shares which your processes flag up, not to mention the systems which other Stockopedia writers use to flag up potentially promising shares.
That's an excellent return Ed and beats what I tend to consider to be the pond you are fishing in (StockRank > 80) which (dependent on exactly filters you apply) broadly in the same ball park as the market - IE down nearly 20% YTD.
What I find interesting though is the extent to which NAPS underperformed the market during the downswing, the same was true in the pull back from the 2018 highs and the same pattern (to a lesser degree) panned out for the broader SR > 80 pool.
You said in the past that you expect that, but I wonder what the logic is?
I guess part of it must the market cap diversification that you apply - the big caps tend to be much more resilient. The Mkt Cap weighted FTAS actually outperformed all bands of the Stock Rank from Mid Feb to lockdown.
There is more to this than just market cap weighting though as the StockRanks performance bands pretty much went into reverse .
Of course if you'd been NAPping since the new year you might neither know nor care and indeed if its just a short term wobble the corrects itself then one shouldn't get too bothered. But nevertheless I am the curious type, so wonder if there are any thoughts about why this occurs?
Gromley -
Checking each factor individually, it looks like M as a factor has turned off completely at the moment and Q has reversed (low Q outperforms high Q).
The reason why Q has reversed might be related to the following table which shows stocks with MCAP>99 & Q<20 sorted by "RS 6m".
Although I've used current Q rather than Q six months ago I get the feeling the pattern is there. A lot of low "Quality Rank" healthcare and gold mining stocks have performed exceptionally strongly over the last six months.
Actually the StockRank performance is equal weight, not market weight... so from that perspective, if the market declines, and small caps decline faster than large caps you would expect almost all cohorts of the StockRanks to underperform the market. That's illustrated by your chart attached.
The NAPS, being biased to small/mid caps are likely to underperform on pullbacks too. The bet on stock markets is that they tend to rise over the long term, rather than fall - so the gains should more than make up for the losses.
This year's NAPS are quite possibly a 'lucky set'... given the base rates. But I do feel the portfolio has been due some luck. What I don't like is that the performance is so narrow - dominated as it is by the gold sector and just a few other stocks. It does make it vulnerable in H2.
Hi Ed,
Thanks for the update on the SNAPS. I'm relatively new to using Stockopedia, do you hold a NAPS/SNAPS portfolio, or is it purely a hypothetical?
Thanks
Tom
I've always been clear that this is a model portfolio - rather than a real one. Transaction costs are not included, although dividend returns aren't either. Historically the dividend yield has been over 3.5% which would have more than covered the transaction costs.
My own investment process is similar to the NAPS - although I have a few different accounts that I use for different purposes which adds variation. I've used a number of different iterations on the process, including international investing, rolling rather than fixed rebalancing periods (rebalancing a quarter quarterly), stop losses, and completely long/short, market-neutral versions of the NAPS (which given the 90/10 "return spread" have done extremely well at different times).
I am considering publishing/sharing one of my real accounts and investment decisions in real time. It would be great if Stockopedia could automate that though - we shall see.
Your table of winners and losers ranging from Vistry at -51.3 to POG at 210 is interesting because it is a very visual demonstration of the fact that a fall of -50% needs a rise of +100% to be balanced, and in general the rises and falls are related as reciprocals (e.g. -20% to +25% (4/5 to 5/4), -25% to +33% (3/4 to 4/3) etc).
It is often implied that because a fall of -50% needs a rise of +100% that somehow this is "harder" to achieve. But in general stock movements are all based on multiplication so a fall of -50% and a rise of +100% are the same geometric magnitude of change. And we see this happening with this portfolio.
A key benefit of this is that when you take arithmetic averages (for example by regular rebalancing) you get a small gain. For example -0.25+0.33 = +0.08 and -0.5+1.00 = +0.5. If your portfolio contained matched pairs of risers and fallers with the same geometric movement you will see a small positive gain because of this effect. (Mathematically this gain is approximately 0.5 sigma^2 where sigma is the volatility of your portfolio.)
In fact with the current portfolio the risers have out-performed the fallers. We are balancing a rise of +210% against a faller of -51.3% and so on.
I did a quick QQ plot using a log-normal distribution for the 20 returns on the portfolio from the table:
A QQ plot plots the returns from the table on the y axis against a theoretical distribution (in this case log-normal) on the x-axis. If the points lie in a straight line then the distributions match and for the purposes of the present discussion this confirms that the returns are balanced geometrically as discussed above.
In practice we can see that the top two returns are well above the line formed by the other returns suggesting a "fat tail" on the right hand side. Possibly "luck" but certainly good news for the NAPS portfolio this year!
That's a great chart Nick... much appreciated.
Certainly over the years there have been a lot of standout annual winners reaching 150%+ in a year that appear anomalous... e.g. Games Workshop (LON:GAW), Iqe (LON:IQE) did 250% each one year, Petropavlovsk (LON:POG) this year, Dart (LON:DTG), Ig Design (LON:IGR) in previous years.
Comments have often come back that the portfolio has been 'lucky' as one or two stocks often dominate the return profile - and people jump to the conclusion that the results should be discounted. Interesting to see you've got a good angle on why these kinds of return distributions are actually to be expected!
yes Ed - I should clarify that my "luck" comment applies to being nicely above the line. But lying on the line is entirely to be expected.
I've recently been doing this kind of analysis on Sharpe Ratios (which are basically risk-adjusted returns) and using longish periods (3-5 years). With an appropriate "risk-free rate" in the Sharpe formula the closeness with which they fit a log-normal is quite extraordinary. Markets seem to be very close to efficient provided you ask the right question.
I've reattached the plot again below because I made a slight mess of the x-axis. Not many will care, but with the correction you can "read off" the mean (the y value corresponding to 0 on the x-axis) and the standard deviation either side of the mean at -1 and +1.
how has your sharpe ratio portfolio been working for you?
In general, I would say that Sharpe Ratios are the only TA method which I have found to work and they tend to perform with similar returns to using fundamental analysis. You need to use a "risk-free rate" (rfr) of about 15-25% though. The rfr acts like a minimum acceptable rate (MAR) rather than a cost of borrowing.
Afternoon Ed,
I have a question around the following:
Every half year I re-run the NAPS process to create the Semi-Year NAPS - or SNAPS portfolio. Please note that the selections below were made as of July 1st, using the final data from the end of the first half of the year. They have been selected entirely systematically.
What exactly does this mean in terms of portfolio management? Do you sell all the stocks that no longer qualify for the portfolio and use the money to buy newcomers? With the criteria to buy 95+ VM and QM, wouldn't that result in a lot of churn?
I really need to collate all my thinking on the NAPS into a single document & course. But some simple answers are as follows:
Hi Ed
I have not even read it yet but wanted to say thank you for the update.
Regards
Michael
Hi Edward,
Many thanks for this update.
I have been a Stockopedia member since 2012 and greatly benefited from the services provided, actually found it truly life-transforming. I have gained growing faith in Stockopedia’s value, quality, and momentum systemic diverse portfolio management mantra.
So let me give you and the team a great big thankyou.
Kind regards,
BSV
?