Stockopedia Subscriber Performance Survey 2020

Twelve months ago, stock markets in the UK and around the world were facing turmoil as Covid took hold. The initial price reversal was breathtaking. But unlike other serious sell-offs in recent memory - particularly the 2009 financial crisis - markets bottomed-out quite quickly.
Within weeks of the pull-back last February and March, some stocks and sectors were recovering. Others were even flourishing. Across the market there were emerging lockdown winners (and losers), all set against the backdrop of exceptional economic chaos.
It all set the scene for a year in which investors could (and some did) do very well in the stock market -- and that’s exactly what we heard in the results of our 2020 subscriber survey, which we sent out recently.
A successful year for many investors
Every year we sound-out Stockopedia users to hear how they’ve fared in the market and whether they’re feeling bullish or bearish about the future. Despite the fear and volatility that dominated the early months of 2020, ultimately shares did well, and so have many of our subscribers…

Indeed, a very solid 86 percent of the ~1,400 users who replied to the survey said they had outperformed or significantly outperformed the market since they started using the platform. Thirteen percent said that they had matched the market, while just four percent had underperformed or significantly underperformed.
Those results are quite a leap on the already strong performances reported a year earlier, in 2019. Back then, seventy percent of respondents said they’d outperformed or significantly outperformed the market since joining Stockopedia, with 22 percent matching the market and eight percent underperforming it.
Digging into the detail of 2020, an impressive 16 percent of respondents said they’d seen a performance of more than 50 percent in the previous 12 months. Nineteen percent said their performance had come in at between 30 and 50 percent. Forty-three percent said they’d seen a gain of between 10 and 30 percent. And fourteen percent said their performance had been between zero and 10 percent.

Widely held winners in 2020
As for widely held winners, our findings from the 2020 survey show a huge number of names. We asked respondents to tell us which stocks had given them the best returns, and the table below highlights the most widely held winners and how they performed:
Share | Ticker | % of respondents | 2020 Gain % |
SLP | 9.5% | 122.5% | |
GAW | 4.4% | 84.7% | |
SMT | 3.8% | 107.2% | |
NCYT | 3.1% | 6050% | |
VLX | 3.0% | 98.7% | |
BOO | 2.3% | 14.7% | |
BOTB | 2.2% | 342.4% | |
FXPO | 2.1% | 91.3% | |
ITM | 1.9% | 537.4% | |
TSLA | 1.6% | 673.7% | |
CDM | 1.5% | 131.3% | |
CWR | 1.5% | 390.7% | |
ERGO | 1.5% | 168.5% | |
IPX | 1.1% | 81.3% | |
SDI | 1.1% | 53.2% | |
GGP | 1.1% | 1916.4% | |
MPAC | 1.1% | 112.2% | |
MWE | 1.1% | 76.8% | |
G4M | 1.0% | 224.8% | |
RIO | 0.9% | 20.8% |
Here are some of the highlights:
- Mining and metals was a very hot sector in the uncertainty of 2020, especially on evidence of a new commodities supercycle emerging. South Africa-based PGM specialist Sylvania Platinum was the widest held top performer. But there were stellar gains achieved in stocks like Greatland Gold, and even large-caps like Ferrexpo and Rio Tinto delivered solid returns.
- Covid winners emerged all over the place, but some micro-cap biotechs with testing expertise went stratospheric. French biology company Novacyt was one of the biggest, with a 6,000+ % gain through the year.
- Tesla was probably the biggest name in stock markets around the world last year. It became a symbol of the incredible momentum in US markets, and was the only non-UK stock to make the top 20 here. One of its biggest institutional holders - Scottish Mortgage Investment Trust (which holds a number of US tech giants) - was the third most widely held winner, with Tesla itself in 10th.
- Growth stocks and high quality compounders continued to deliver in 2020. PI favourites like Games Workshop, Volex, Boohoo, Best of the Best and SDI among others, proved that they could be depended on.
How do Stockopedia users see themselves?
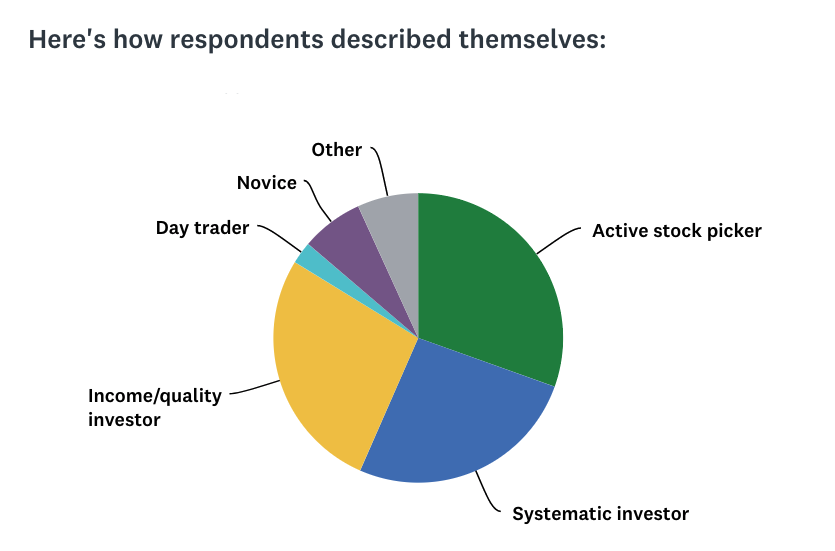
Our subscriber base has grown strongly over the past year and the majority continue to classify themselves as either Active Stock Pickers, Systematic Investors or Income/Quality Investors. The proportion marking themselves as Active Stock Pickers has increased to just over 30 percent from 25 percent last year. That perhaps reflects a sense that investors have felt the need to be more hands-on with their portfolio selections this past year - and, of course, that dividends from income stocks were decimated in 2020.
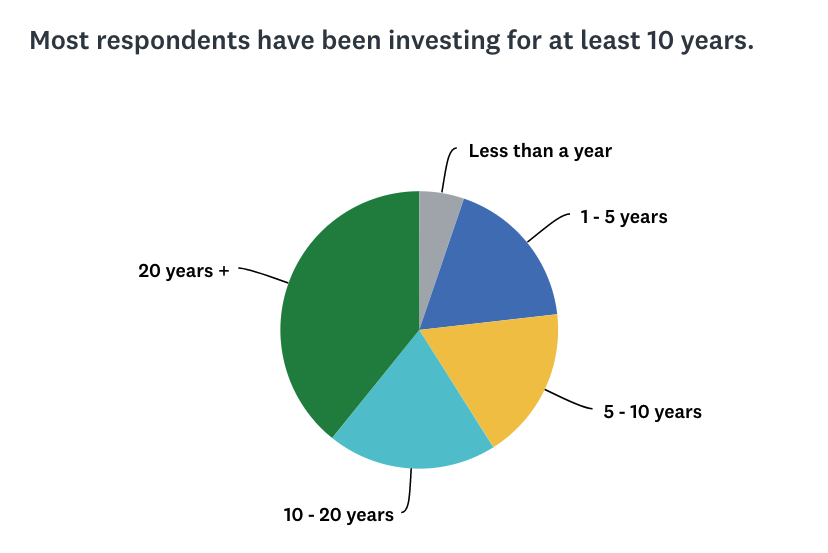
In terms of experience, Stockopedia users have a fairly broad range of years spent investing, with nearly 40 percent of respondents saying they've got more than 20 years of experience behind them. A promising move from last year is that the proportion of users claiming to have been investing for less than a year has shifted from around 2 percent in 2019 to more like 5 percent in 2020.
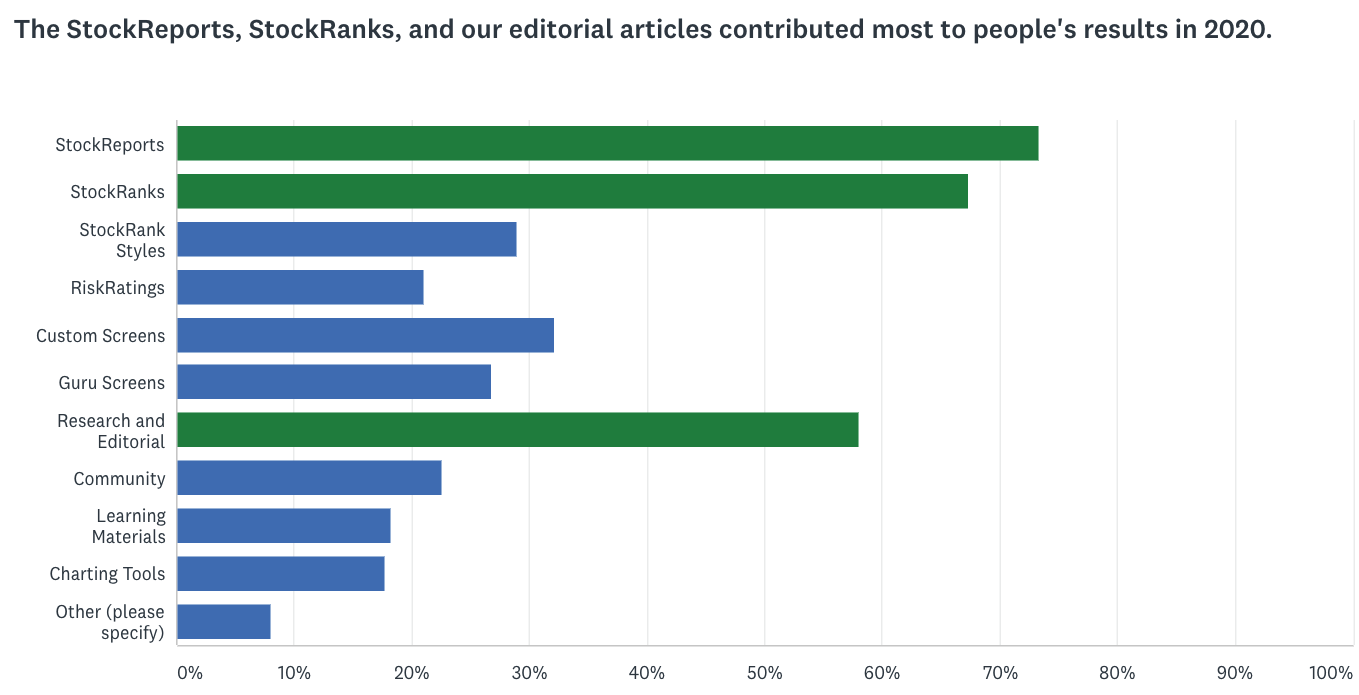
And for many users, our StockReports, StockRanks and Editorial continue to be some of the most popular features of Stockopedia - certainly in helping to improve portfolio results.
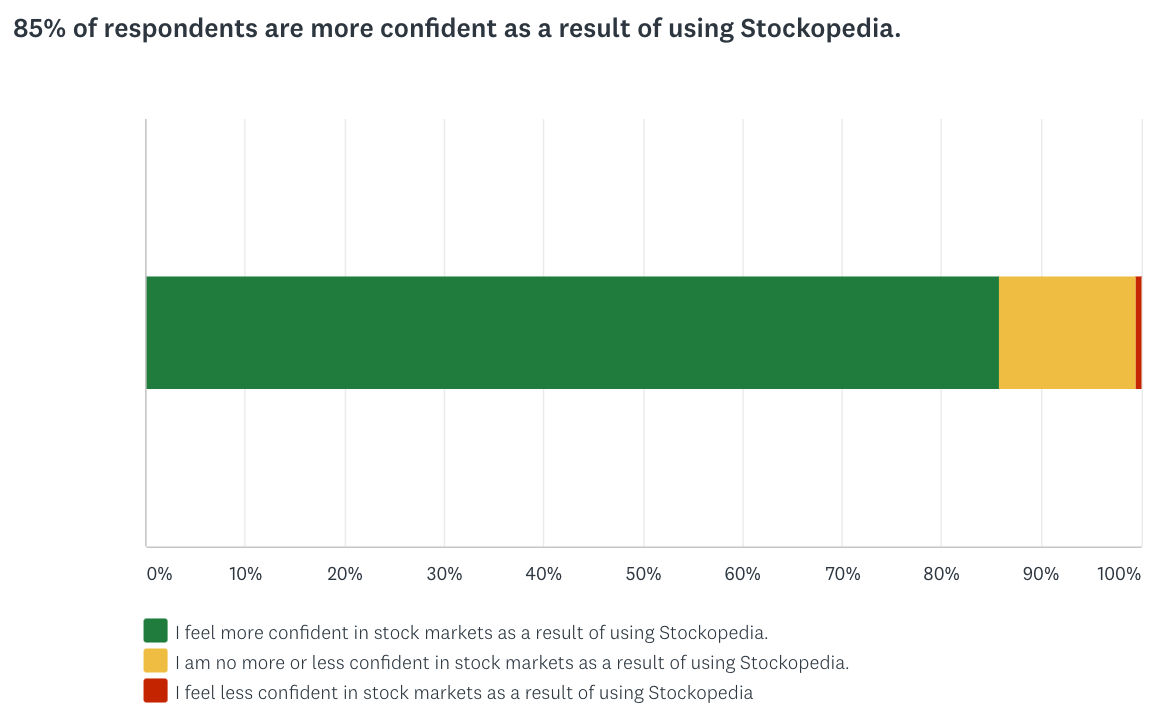
Finally, another promising response from respondents to the 2020 survey is that the majority feel more confident about their understanding of the stock market since they started using Stockopedia. This is a slightly self-serving question, but we would still expect market conditions to influence how users reply to it. So it’s interesting that the proportion feeling confident in their investing has increased from 75 percent in 2018 to 82 percent in 2019 and now 85 percent in 2020. Confidence is at a high, presumably because the market may continue to recover as the Covid crisis wanes.
As always, thanks to everyone who took part in the survey. The responses are hugely valuable to us and offer a very interesting view of what Stockopedia users are thinking and how they are performing.
As ever - Safe investing
Disclaimer
This is not financial advice. Our content is intended to be used and must be used for information and education purposes only. Please read our disclaimer and terms and conditions to understand our obligations.
56 comments
Why can't I find anyway of talking to A HUMAN AT STOCKOPEDIA
I guess they don't want to get into danger of saying something that might be construed as finacial advice.
I too have a problem contacting Stockopedia and thought this would be the best place to sort a problem out.
I have the UK and US subscriptions.
When I open up the Stockopedia on the Today page screen the Nasdaq Compasite index is never up to date. In fact it is at least a day out of date!
The FTSE all share works OK as does the FTSE 100 index & S&P. and all my US portfolios, BUT why does the Nasdaq Index not work? Can somebody please fix it please.
All the other US sharea changing th StockRanks show te correct values and are on the same page. This is so frustrating.
Nasdaq is now still showing -2.4% from yesterday. This is clearly not acceptable & needs fixing with immediate effect. Thanks
You should use the green button, bottom right of the screen and then a human should make contact with you. But it is not talking.
Hi Herbie,
There is no green button on the screen. The Nasdaq Compasite Index is still out of order. Is there anybody there to fix it? Also how do you get the green button back on the screen? Help please.
Yes there is, I can see it now.
Why don't you contact the Support team?
If that is a problem, I suggest you start a new post about it, as it will more likely to be seen by the Stocko team, rather than buried in here.
You can contact support via the green button in the bottom right of the page as shown below:
If you cannot see this, an ad-blocker may be hiding this. Can you try adding Stockopedia to a 'safe' list?
With regards to the Nasdaq Composite - I can confirm the prices look to be up-to date now as shown here:
https://www.stockopedia.com/in...
I use Adblock but I can still see the green button.
Thinking about the value I get from my Stockopedia subscription I believe what has contributed the most to my performance during 2020 is the SCVR and the discussion this fosters
Maybe the difference in performance could be due to those who sold quickly and those who held on in March 2020. And then, those who belatedly sold to quickly buy in when stocks started to recover Oct. ?
I am new to Stockopedia and found the result of the survey really help and insightful.
I think this survey is fundamentally flawed, because people whose portfolios didn't perform well last year are less likely to have taken part. I should know, because I was one of them!
Actually, my portfolio's performance was complicated, because during the Covid drop last year I decided to de-risk my portfolio, I converted most of it to cash, and I used some of that cash to pay off my flexible mortgage, because I decided it is not wise during a pandemic to use borrowed money to invest in the stock market. Once the market started to recover, I was slower with hindsight than I should have been in reinvesting the remaining cash in equities. But since last summer, my portfolio has out-performed the FTSE All Share index. However, I thought all that complication made it difficult for me to respond in a fair way to the survey.
For a little effort with a spreadsheet you can unitise you're portfolio, this allows you to calculate returns while taking into account monies added or removed from the portfolio throughout the accounting period.
How to unitise
(and I refuse to spell unitise with a z !!)
pka - Yes, I agree that poor performances will be under reported and exceptional performances fully reported. This does not make it invalid as such, just to be factored in to any interpretation.
I think that this is true.
But one challenge for myself is I report by Financial Year, so 06 April - 05 April, not calendar year as 2 of the 3 peoples money I manage is not all yet in tax shelters (ISA/SIPP). But yes I do have a Spread Sheet to track it all, as well as the Folio on here, though that does not record everything such as Fundsmith, which is my Microsoft holding.
But then we have the FOMO, my biggest loss (sold at 50% down) would now have been a 50% gain...do we have a what was your screamer and what was your howler competition?
Tommy
You don't say if and how you used the ranking system and suggested rules.
Interesting results - could I request a quick clarification - is the benchmark the FTSE all share index, which I reckon went down by approx 11.7% over the year ? If so I'm chuffed to be included in the outperformed category with my 1% loss over the year :-)
I agree with Herbie and Richard Ellis, cash seems to dissapear in Stoco's Portfolio , which is frustrating.
What is the total number of subscribers with Stockopedia? As I mainly deal in the US market, it has no mention of shares in the US or other countries either.
As long as the portfolio is constantly above inflation I am not worried.
Just got the book Paul recommended 100 baggers by Christopher Mayer. Only about half way through & should help increase returns by not selling too soon. This has been one of my biggest mistakes. Last year I sold APPS (digital Turbines ) too soon and now it would be up 823% and climing.
Although I did not take the survey, 2020 Stockopedia has certainly helped with the dividend income @ 11.4% which all helps the portfolio to grow.
djrhs - I am not sure that is the way most investors calculate performance. I just sum all the gains / losses from my transactions and divide by portfolio size at the end of the year to get the % gain /loss. In this way any additional funds added during the year are actually a drag on performance - because you only have part of the year to invest those funds.
however - youy could be right - because performance does look so strong as to be almost unbelievable
Exactly. I don’t believe the figures. Are we all Warren Buffett in disguise?? The FTSE started 2020 at 7500 and ended it at 6600. And yet only 15% had a losing portfolio during 2020.
I do think the way the performance is shown graphically on Stockopedia is misleading and has contributed to some overenthusiastic declarations!!
Yes I think it is favouring the better performers, they are more likely to complete the survey because they have done well. But NAPs was up around 28% I think, several of my UK watchlists were up around 20%, so it is possible, especially if you did buy around April time.
On folios I find the way Stockopedia calculates the performance incorrect, if I sell a load of shares then my portfolio chart falls and the opposite if I buy.
Also on shares if I sell then that is the gain/loss figure but if I rebuy then the figure falls about 50%, if same amount. Cash seems to disappear on the new site.
End of the day Stockopedia has improved my performance, I swapped my Investors Chronicle subscription for Stockopedia, although it is more expensive it is in my opinion well worth it, I think this is the point of this article.
Right! I think SP need to throw some light on this.
Maybe it's that the respondents tend to be the ones who've made a good return. If so, then the statistics are fundamentally flawed. SP say they had ~1400 respondents - how does that measure up to the number of subscribers?
A lot of questions (& not so many answers)...
Hi Richard,
I think we will introduce some changes to the survey next time around. It's interesting for everyone to see this kind of thing , but I don't want to give the impression we're presenting misleading data. The trade-off with adding more complexity to the survey (such as standardising the calculation of returns (which many approach in different ways)) is that we'll just get far fewer people coming back to us. So we'll need to think about it carefully.
The survey itself serves a few purposes, one of which that it's very important for us to hear from users about how they are feeling and the actions they are taking. And part of the reason for publishing some of those results here is that it's good manners to those who responded to us to give them the bigger picture of what everyone else said.
There is no question that a survey like this is going to be skewed in some ways, just by the nature of it. And if we continue with it we'll need to consider how to tackle that.
Thanks, Ben
If we could see the number of subscribers who didn't respond - maybe as a second bar on the first chart on performance - that would give the picture of how much leeway to give the rest of the data.
Mikex1
It could be argued that this is a more honest way of measuring performance. However, if your performance (calculated this way) is X and the performance of the alternative fund (as published) is Y (where Y is greater than X), you may come to the conclusion after Z years that there is no point in putting in the effort/stress etc of investing personally. And and then switch your investment to your chosen funds, whereas in reality you may have been outperforming those funds by one or two percentage points.
Out performing my chosen alternative bench mark (a group of four funds) not on a monthly or yearly basis but a multi-year basis is what keeps me investing and putting up with the stress of it. I have a personality that does find it stressful and therefore need that motivation. Every point of out performance is important in this motivation.
My performance has been as below and while apart from 2018 and 2020 it looks quite impressive it is actually a CAGR of 15.075% for the six years to 2020, so just above my threshold of 15%. Even then I would have been significantly better off having put the whole lot in Fundsmith and done something else. That said I would have been incredibly bored!
2015 16%
2016 32.3%
2017 34.8%
2018 -11.6%
2019 26.8%
2020 0.2%
2021 YTD 9.1%
regards
Michael
Accuracy in assessing one’s own Portfolio performance would be easier if any cash added during the year were not just shown as apparent outperformance. For example, when I put in £20,000 in April as an ISA allowance, my apparent performance (against the FTSE) shoots up!! This does give a false impression of having done well, even though I know it is fake.
It would really be great if the graph could show true performance against an index rather than just total portfolio value related to that index.
It is sufficient that we are aware that when and if we add more shares in a portfolio the performance graph gets skewed upwards. As I am, since all of the dividends I get awarded plus any cash going spare is invested in my portfolios. If precise recording is desired then it is simple to DIY by creating an Excel spreadsheet dating all investments made and subtracting the total from the contemporary Stocko portfolio valuation. Personally I turn a blind eye and sleep better for it.
I had exactly this problem of new cash appearing as investment gains. Stockopedia are working on it. The solution in the meantime is to make a note of the starting date of your portfolio (in my case, 2 February 2016). Then I know that any new capital that I put in needs to be dated 2/2/16 and the performance will be shown correctly thereafter. Same applies if there are withdrawals (over the years I have tended to withdraw from my ISA and add to my SIPP).
This made for a slightly tedious task of going through all transactions, making an equal withdrawal on the same date as my contributions and then making the contribution again with the starting date so that the current total is once again correct. But you only have to do it once.
Dividends are different - they do represent part of the year's gains and ought to be shown in-year. You can allocate them to individual shares but tbh I usually just put in an amount as a contribution every couple of months, so as to reconcile 'Stockopedia cash' with real cash.
I've also asked for them to try to get at least the performance graphs to not treat deposits/withdrawals the same as investment gains umpteen times and I remain surprised it has not been implemented as it obviously useful and really isn't difficult. I also have to run a separate spreadsheet to get a proper return graph.
And me! Come on guys at Stocko: you can do this!
Hi TimeAnd Tide - I must admit that being a bit of a pedant NOT having my Stocko Portfolio reflecting Cash movements correctly had me searching for a solution via Mr Google
NO RECOMMENDATION HERE - But I am now using a Free Application called PortfolioPerformance (I use MacOs). It allows you to set up your Cash account and record all movements. It also allows you to set up your Investment (Securities) from the ticker, which will automatically load pricing. You can run more than one portfolio so you can have watchlist "Folios" It gives a lot of Portfolio performance charting and calculations It even allows me to record Trade Dealing and Tax costs separately. I balance my holdings daily
Stocko team - This is my specification for transaction and performance recording and reporting
Thanks Ezlifeme - I'm also a Mac user so I'll have a look at that and see if I can export to it. That being said I only want to keep a folio in one place and I'm loyal to Stockopedia so it has to be here ,so I will most likely just stick to nagging about this feature!
Hi TimeAndTide - Yep imports work (Various std formats) work. The only reason as a happy Stocko user for all the valuable data and forums is I can track my real portfolio performance (As I hinted just want it in Stocko)
I would agree and that is why I use Sharepad to track my actual performance.
I believe I have read some where here that real performance tracking in Stocko is coming. Maybe somebody from Stockopeadia can confirm or deny.
Product roadmap suggests a referrals programme is a higher priority. As others suggest, creating your own spreadsheet has real benefits when you are awaiting this long called for upgrade....
https://portal.productboard.co...
Yes I was aware of the Refer a Friend being the top priority and while I consider myself a loyal (since 2012) user and a bit of a Stockopedia fan boy (well old man) I am frankly amazed that the “refer a friend” is the highest priority.
Personally I would have thought that improvement in the product (portfolio tracking, inclusion of funds, back and forward buttons in the app, Level 2, better presentation of the news feed to name a few) would be the best way to drive new client up take. But what do I know!! :-).
Thank you for the link to the product board. I was unaware of this.
Regards
Michael
I certainly agree with you. The current chart is showing change in valuation over time, which of course means that if you are adding or removing cash to the portfolio then this influences your portfolio valuation and leads to apparent spikes in performance.
In order to provide a better comparator of investment performance, we plan to add a time-weighted return chart to the folios area. This metric excludes the influence of deposits and withdrawal (but maintains dividends) which should make it easier to understand your portfolio performance and compare versus reference benchmarks.
That is one of the big challenges with the way the Portfolios are structured.
Stockopedia have looked at but it is not easy to fix.
I have a way in my Excel sheet of calculating what the contribution of all these should be, so ISA is easy as deposit made 06 April, take value at 05 April the following year, is it up or down and hence %.
My share account I pay in each month, effectively my wash up savings account as I do not need any more cash right now. So hence it looks like amazing performance if you do 31 January 2021 deposit £1000, so I end up now having to put all deposits on "Day 1" which then shows a lag in performance as it thinks you held cash for a long time. In addition my 20+% down last July (my personal low point in 2020) now shows about 15% down due to the additional deposits since then.
Again I can track in Excel as I do a monthly valuation (5th of each month), and then have a contribution of any in month to achieve a target by the end of the year. I have basic (Cash ISA return), Long Term and Stretch targets. Took a couple of goes to work it out but seems to get it about right. So this can tell me to get say 5% return in a year, I should have £XYZ given the original balance and deposits made through the year, and hence am I on track, ahead or behind in any given month.
A super interesting piece of research!
One thing struck me immediately, the stocks people invested in .... no Apple, Microsoft, Nvidia, Google etc Fyi, I'm almost 100% invested in US technology stocks.
That won’t be correct, but it is the best performing, I invested in 3 out those 4 but none were in my top 3 performing shares last year, although Apple and Google did very well.
I use the 5year peg ratio is the greatest help in picking stocks, that's what guided me to Sylvania Plat. But I find it very difficult to learn how to set up stock screens to do what I want. I have been watching Ceres Power Holdings for over 5 years (Basically because I am very interested in the use of Fuel Cells myself) and am very surprised how many people have piled into this stock, when you consider they always seem to be begging investors for more money, but never seem to get anywhere. I also find it very difficult to find any metric for judging the merits or not of companies that have never made a profit. As an example Amazon was trading at a loss for at least half a decade as I rember it, yet it turned out to be a real winner..
How accurate does anyone think the results of a survey like this are?
Revolution bars didn't do quite so well. Convenient silence.....
“ How accurate does anyone think the results of a survey like this are?”
It will be less accurate than an opinion poll of voting intentions in an election. In any survey of this nature, as mentioned above, there is a strong potential for those that responded to do so because they have had a particular outcome. To improve accuracy it is necessary to make a lot of extra effort to get everyone in a sample to respond. It’s also necessary to try and avoid confusion around issues such as collective investments. SMT is apparently included, but if that’s included should respondents also be factoring in the performance of any holdings in funds, ETFs, other ITs and so on. If some respondents did and some respondents didn’t then the results become rather doubtful.
It’s an interesting little exercise, but the results are unlikely to be reliable in my view. So, I would treat it as mild entertainment and nothing more.
Very interesting and helpful summary. Falling in the 20 years plus group, it explains the statistics that 86% outperformed. It always is and always will be time in the markets not timing the market..
I am much much more confident investing now with the use of Stockopedia
Maybe a geeky market researcher's point, but I wonder if people reported their returns on their total liquid assets(e.g. cash and shares etc) vs just on the amount they invested in stocks. For me, one of the biggest calls is how much to hold back in "safe" assets vs how much to commit. It's much easier to hit an aggressive return if you are only risking a small part of your net worth.
I'm surprised Boohoo (LON:BOO) gets a mention as only a 14% gain.
I think it would be useful to be able to put in your top 3 or even 5 performing shares, I'm sure some of those winners are much wider held but if I have put in Sylvania Platinum (LON:SLP) then I can't put Codemasters Group (LON:CDM) and Ergomed (LON:ERGO). Is it biggest winners by % or £s?
Would be interesting to know the number of members who completed this survey out of total number.
Boohoo £BOO was a 14% gain for 2020, but presumably people would have invested in March or July for a much larger gain
Yes that is true, good point. So the annual figures can be a bit misleading. I'm sure most people did not get 6050% gain on Novacyt SA (LON:NCYT).
My pre-Stocko performance was worrying, I have done much better since joining but did not complete this survey. The string of political intrigues since the ousting of the Labour Party from power has taken its toll on my investing. I may not complete the survey next year either but look forward to doing it the year after that. I am a paid-up member till then.
I think your analysis of the respondents is spot on, BUT when the sample isn't an accurate reflection of your subscriber base, the figures are to be taken with a pinch of salt. My point here is that people who think they have done well are far more likely to hold their hand up and be counted compared to someone who hasn't, and wants to forget the year. I think your analysis would be much more meaningful if you took a random cross section of subscribers and had a truly representative sample.
Difficult to do a random cross section as you can't force anyone to respond, but perhaps the results could be prefaced with the percentage of the subscriber base who responded?
I did respond and found the confidence question a funny one. Confidence is not always a good thing. My first ever foray into the stock market was a purchase of Lloyds shares in 2008 at a bargain price of about 130 pence. I felt pretty confident about it for a short period before they went down to under 30p. Hopefully I am wise enough not to be quite so confident now!
Someone like HL who actually holds the assets for us would probably have a much better idea of whats actually going on amongst Stockopedia users.
Or ii to which the Share Centre recently passed my records from year dot, I bet they make for some interesting reading!
I do agree with you. I think if we continue with it we'll need to explore ways of expanding the sample size or changing the nature of the survey. The problem is that it is just a survey and there's no compulsion for anyone to reply to it at all. Those circumstances probably do open the door to all sorts of behavioural skews in who does and doesn't reply.