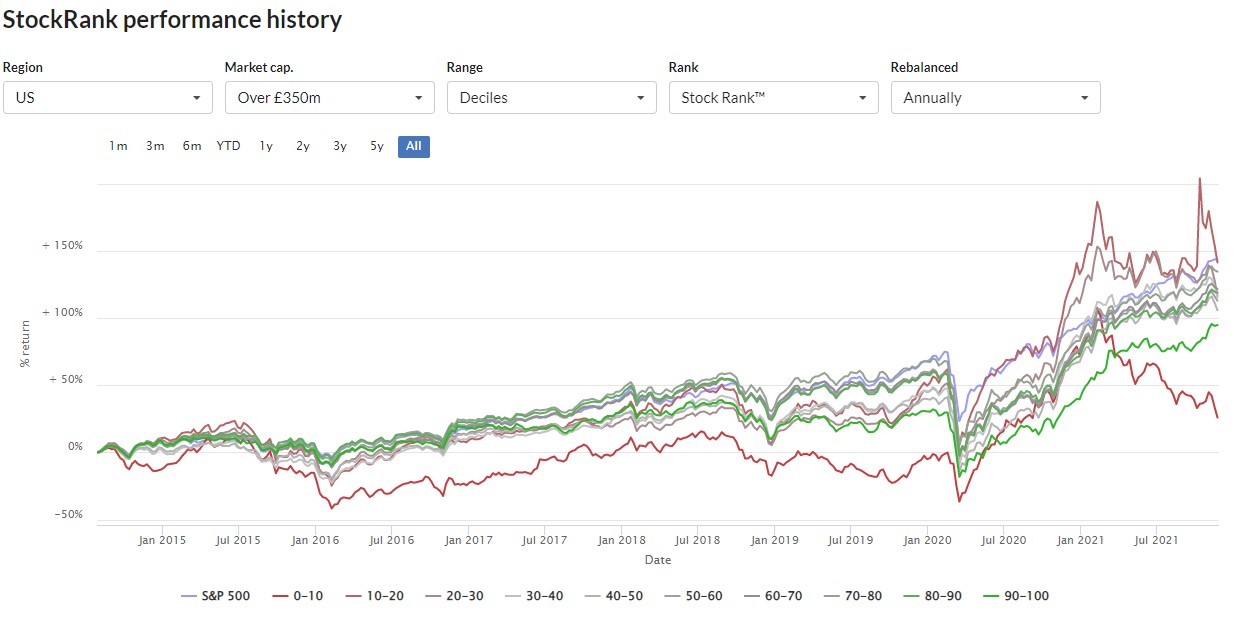
I was looking the performance charts here: https://www.stockopedia.com/le...
Over the last year, the FTSE All Share index is up 27%, however all the Stockopedia bands are up more than that, the worst (0-10) is up 37.4%, the best (40-50) is 55.2%.
I would have expected some to be below and some above the index.
I'm struggling to understand how this can be.