So probably I am mid-reading the performance graph, but anyway here goes...
I was playing around with Stockranks performance, especially momentum. Mainly curious to see how momentum has performed over the last year, which has been something of a bear market. But also interested how overall Stockranks perform in a downward market.
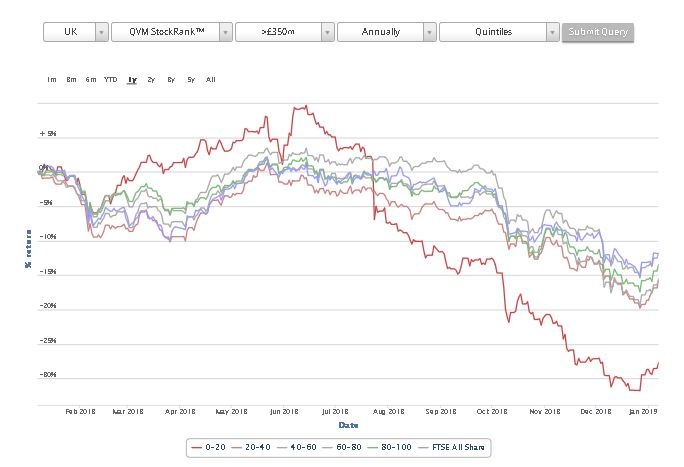
So I put into the performance chart a filter of market cap > £350M, split into quintiles and looked for a 1 year chart performance with annual rebalancing. Which presumably means the chart represents a buy and hold portfolio over a year.
Curiously, every quintile appears to underperform the index! Doesn't sound possible. Any clues as to what could be going on?


This is what I see
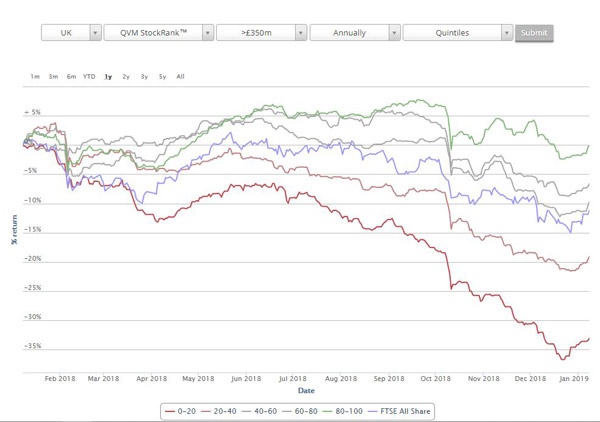
Are you seeing a different chart?