Share price: £8.30 Market cap: £679m
Shares in issue: 81m Dividend Yield: 0%
P/E: 23 times now, and falling to 13 times, based on profit guidance.
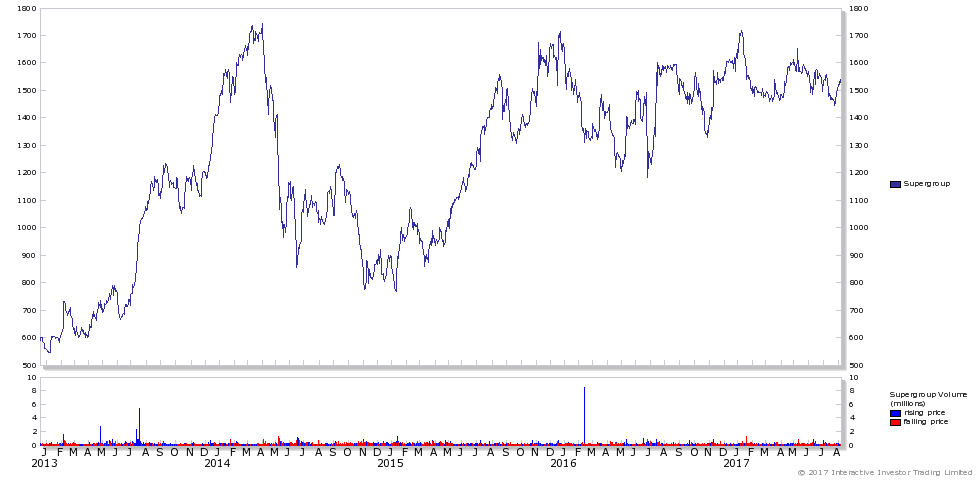
A clothes retailer listed in the stock exchange since 2010. The company’s share price is a bit of a rollercoaster (going up and down like a Yo-Yo), as shown below:
Figure 1: Supergroup's share chart
BACKGROUND
It is founded on the basis of being a cult-icon for young fashion, and it is most famous for its SuperDry brand label.
Now, it is an international brand with stores around the UK and Europe (mostly).
Its founder recently stepped down from CEO role.
A DREAM RETAILER TO HAVE IN YOUR SHARE PORTFOLIO
Ignoring hindsight for now, I would say if you invested privately 11 years ago, your returns probably total nearly 2000%, a wild guess you may call it, but based on the these assumptions below:
Seven years ago, Supergroup has revenue of £27m and barely made money, today the business posted revenue of nearly £500m and profits around £30m.
One would think it is not too far off the mark.
It business is being promoted by management as being a growth business because the founder used phrases like: ‘like-for-like don’t tell the whole story’ or ‘we are opening more stores’.
The question now is, can this growth be sustainable and can margins being maintained in the expansion phase.
To measure this we need to put our faith in the following:
1. Our trusty ratios;
2. The like-for-like metric; and
3. Miscellaneous KPIs data and information from financial statements.
All this will help interpret for us if the company is still a growth business.
First up our trusty ratios, looking at ‘Figure 2’ we see the returns on assets and capital have fallen by 10 percentage points on all measures from just four years ago.
Figure 2: Profitability and returns ratios
| 2014 | 2013 | 2012 | 2011 | |
| 3. Return on Assets | 7.5% | 11.6% | 13.3% | 13% |
| 4. Return on Net Assets | 9.5% | 14.2% | 16.5% | 15.8% |
| 5. Return on Capital. | 16% | 21% | 23.5% | 25.4% |
| 6. Return on Capital Employed. | 15.2% | 20% | 23.5% | 24.9% |
| 2. Operating margins (%) | 10.4% | 14.3% | 16.4% | 19.8% |
| 1. Net Profit (%) | 6.4% | 10.1% | 11.5% | 12.6% |
The company’s margins (both operating and net), both these measures have since been halved.
These can be worrying trends to consider, but is the company losing its fashion sense? No, if you see ‘Figure 3’, where revenue so far has nearly doubled in…