Surfing the StockRanks

When to Sell
One of the hardest parts of being a value investor is knowing when to sell. The investment industry rarely talks about selling. When it comes to research, brokers seldom recommend that investors sell a stock. Even a "Hold" recommendation is relatively rare. The reason is that such recommendations don't generate any fees. The advice of investment professionals centres around encouraging investors to buy stocks, invest in IPOs and support companies' share prices. The brokers are incentivised to be positive about fee-paying client companies to retain their business.
This bias to undue positivity is likely to be even worse when the research is paid for by the company. There's a popular saying: "if the product is free, you are the product." This principle applies to the advertising giants, such as Facebook & Google, whose social networks and tools they provide to users for free in return for copious amounts of valuable data. This same principle applies to company-paid broker notes; investors are the product, not the note.
In this environment, it can be tempting to view a Hold recommendation as a Sell since a broker is likely to have made this recommendation begrudgingly. However, the reality is that broker Buy/Hold/Sell recommendations have zero predictive power about future stock prices. Investors are as likely to generate returns from that rare Sell or Hold recommendation as from a Strong Buy. (Stockopedia founder Ed Croft explains why in this classic article.) Professional research can be a valuable source of investment information that an individual investor may not be able to access in other ways. However, when it comes to broker recommendations, these should be ignored entirely.
One way that value investors can decide to sell is when a share becomes fully valued. While this may make logical sense, the problem is that valuation is not a precise science. The value of a business depends a lot on future assumptions that may or may not prove correct. This doesn't mean that I think that estimates of intrinsic value are impossible, just that they have wide tolerances and are sensitive to changes in corporate performance, about which investors are likely to be slow in updating their prior assumptions.
The biases leading investors astray
On top of the challenge of valuation, three biases are likely to lead us astray:
Ownership Bias
We tend to overvalue what we own relative to what we don't. This means that as soon we have purchased something, our estimate of intrinsic value is likely to increase simply because we own it.
Anchoring
One way to overcome ownership bias is to set a price target for selling before purchasing a stock. The problem is that investors are still likely to be less than fully rational since these price targets will be anchored on the current price. For example, if the current price is £1 per share, then a share price of £2 will look fully valued, or 50p appears an absolute bargain. This may be the case, but share prices often move on unexpected news, which can move intrinsic value significantly.
Loss Aversion
It is well known that loss aversion means that we tend to fail to take a loss on a position when we should. What is less well known is that loss aversion means that we tend to prefer a high win rate to high absolute returns. This means that investors tend to snatch at winners too soon and sell in order to lock in a profit.
Should an investor never sell?
Ownership bias means that estimates of intrinsic value may be skewed. Anchoring and Loss Aversion mean that investors tend to sell too soon. Given how hard it is to make rational selling decisions, some investors have adopted a "never sell" approach. This is particularly popular amongst quality investors who try to emulate Warren Buffett who says:
"Our favourite holding period is forever."
Unsurprisingly, this approach gained popularity between 2018 and mid-2021 as quality stocks soared. This was mainly driven by an increase in the multiples that investors were willing to pay to own them. 2022 subsequently showed the folly of this approach, as the 1-year performance of the highest QualityRank stocks shows:

The never sell approach assumes that great stocks never have their moat eroded, or become over-valued, or that a better investment opportunity comes along, all of which seem fantastical.
It is also worth noting that Buffett and Munger hold meaningful stakes or own whole businesses in an investment vehicle where investors can sell their shares but cannot demand their money back directly from Berkshire Hathaway. Never selling can be a dangerous strategy in an open-ended fund. The manager may have diamond hands, but if the individual investors have glass hands, the manager will be a forced seller at the worst possible time. Something I speculated may have happened with the Buffettology fund and Focusrite (LON:TUNE) when I looked at the company here.
Momentum
One of the reasons that value investors tend to sell too early is that they fail to take into account momentum. It may seem strange, but over periods of six months to a year, stock prices tend to be positively correlated to themselves. Investments that are winning tend to keep on winning, investments that are losers tend to keep on losing. This effect doesn't last forever. Over periods of 3 years or more, the reverse is true; the winners become losers and vice versa. This mean reversion is the Value effect, as the forces of capitalism force a turnaround in corporate performance. The positive medium-term momentum isn't just because shareholders get carried away. It is because investors are slow to react to changes in business performance. Once begun, this positive trend lasts up to a year. To capture this effect fully, the Stockopedia Momentum Rank includes both the share price momentum and fundamental momentum. It is this factor that enables the value investor to make better sell decisions. They can use it to surf the StockRanks.
Becoming a StockRank Surfer
The sport of surfing is a good analogy for investing. When everything goes well, it is a thoroughly enjoyable pursuit. Yet it is hard work and, in the UK, often requires braving cold waters. It requires considerable skill and practice to read and navigate the changing sea, manoeuvre the surfboard, and get up on a wave. Yet there is an element of chance as well. A wave that appears to be perfect may behave unpredictably at the last minute, causing even the best rider to wipe out. Here is what a typical StockRank surf looks like:
The Paddle Out
Reaching the point where the surfer can catch a breaking wave is hard work. The surfer is going against the strength of the sea, and it requires stamina to keep going.

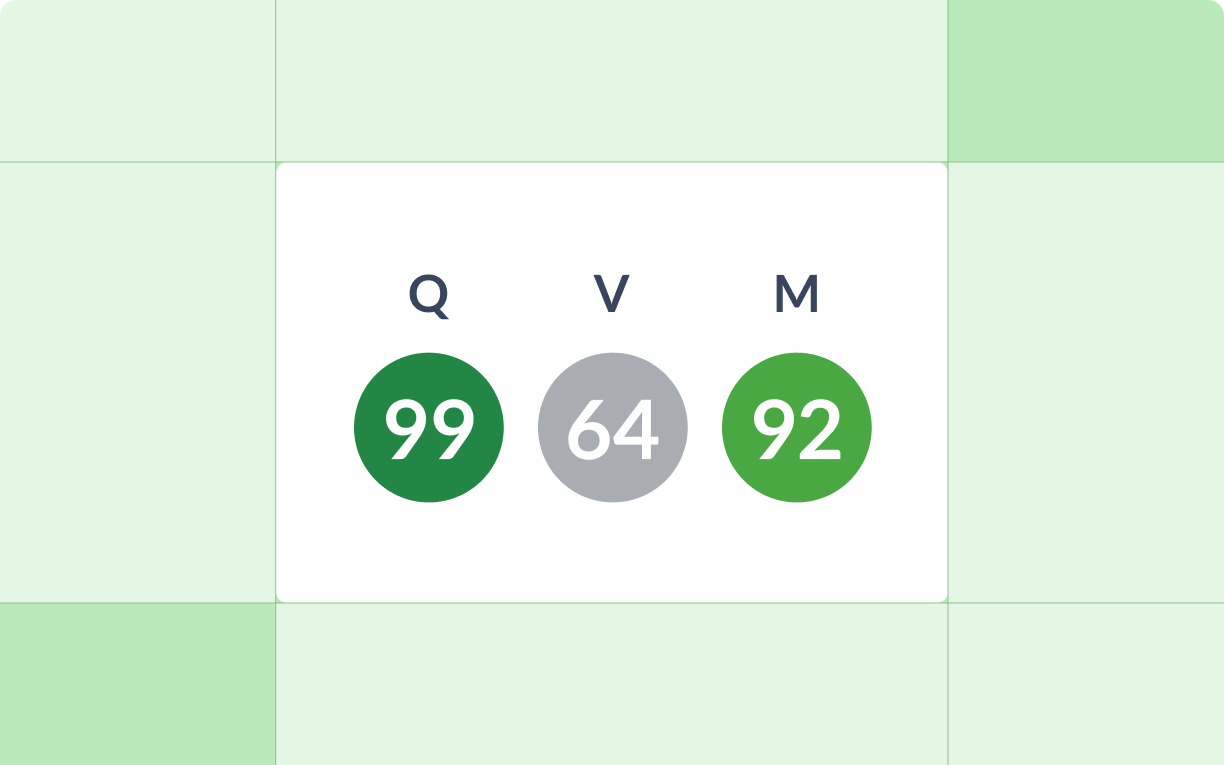
This is the point where an investor is researching a high–quality, potentially undervalued company with a view to investing. This is likely to appear as a QV stock, but the momentum will be weak as the investor is paddling against the waves. This is when due diligence should be conducted, when ownership bias has not yet clouded judgement. If a stock is illiquid, then it may not be possible to buy in size when the sentiment turns. So the investor may start to build a position, but they will do it slowly. Averaging down is an important tool in the value investor's toolkit, but they will use it cautiously while the momentum is against them.

The Turn
After paddling beyond the crashing waves, the surfer is no longer pushed back by the breakers. Instead, they can manoeuvre themselves into the optimum position to ride the wave.

At this point, the investee company remains good value with a high Value Rank, but momentum has started to rise. Value & momentum are often negatively correlated, so as the price starts to increase, the Value Rank starts to drop. At this point, the investor should be at or close to their ideal position size for such a company.

The Ride
Having done the hard work, with a few last well-timed paddles, the surfer can catch the wave, stand up and enjoy the ride.

At this point, the investor lets the market do the hard work. The Value Rank may be dropping, but momentum has taken over, and the stock keeps trending higher. A few checks are still required. Does this remain a quality company? Are there risks that were not foreseen? But, in general, this is a time to enjoy the ride. The contrarian may be getting concerned about the valuation, but while the momentum remains, the investor should hang on.

The Dismount
The temptation now is for the surfer to ride the wave for as long as possible. However, the wave will likely close out at some point, breaking in one final unstable dump. If the surfer is still on the wave at this point, they will wipe out.

Instead, if the surfer can jump off before this point, they can avoid the white water, take a short breather and start the paddle back out, all in a controlled manner.

This is the point where the Value Rank is low, and now the Momentum Rank is fading, too. The investor is ready to hop off the wave, sell the stock, and look for the next investment opportunity. With the Momentum Rank dropping, investors may need to sell after the share price has peaked. This shouldn't worry a savvy investor who has enjoyed a long and successful ride. However, the less astute need to be careful of that loss aversion kicking in. Often investors hold a stock up and all the way back because they anchor on their failure to sell at the peak price. The message is clear, if both the Value and Momentum are long gone, the investor should be too.

Not every investment is as easy as this stylised example. Not every StockRank surf will be the perfect wave. However, if investors struggle with when to sell their Value picks, surfing the StockRanks is an excellent way to avoid those biases we all suffer from when making these decisions.
[Disclosure: Mark owns shares in SCS (LON:SCS) ]
Disclaimer
This is not financial advice. Our content is intended to be used and must be used for information and education purposes only. Please read our disclaimer and terms and conditions to understand our obligations.
23 comments
Mark, Many thanks, an extremely interesting concept. What is your success to failure ratio using this technique? Do you have 1 or 2 examples where this technique has brought you great success? And any where it has ended badly?
I find myself wondering what would one would think the level would be to be deemed having... 'missed the boat'?
Absolutely fascinating and very well wrote. BZ
Is there any way to see the individual Q, V and M stockranks plotted against time for a particular company? The stock report does this for the overall stockrank, but I can't seem to find the individual ones (which would be useful for seeing how momentum is changing).
I think the only way is to look at the prints going back, as Mark said in the article.
Sorry that should be in his next article not this one.
Hi Mark
Just wanted to make a quick comment to thank you for the thought provoking articles, and specifically to say I have enjoyed reading your book 'Excellent Investing: How to Build a Winning Portfolio'.
I have read a lot of investing technique and psychology books so much was familiar, although always worth a reminder. The section on assessing risk, setting appropriate position sizes and hence building a resiliant portfolio was definately new to me though and I am sure will be of huge use.
David
Thanks David
Here's one where it might have been possible to "surf the wave". I only have stock rank data back to 13 March 21 so that is where the story starts.
GSK (LON:GSK)
The Paddle Out
13 March 21 - Share price had declined from a peak of 1859 on 21/1/2020 to current price of 1274. Good Q and V but very low momentum rank. Q 81 V78 M2
The Turn
1 May 21 - 1st Q results published on 28 April seemed OK. Momentum rank jumped to 21, price now 1355 so purchased some shares.
The Ride
From purchase at 1355 momentum rank continues to increase reaching 99 on 18 Dec 21, price 1610
The Dismount
Value rank had been declining for some time. Momentum dropped below 90 on 21 July 22 and value rank had been around 50 so sold at 1745 for a nice 28% gain. A lucky exit as holding much longer would have led to a "wipeout" with the price declining to a low of 1296 in September.
You have a nice writing style Mark - have you ever thought of writing a book? ;)
It took me a very long time to recognise that buying a stock is like a new relationship, full of hope and endorphins. Selling is like divorce. Whether amicable or bitter, it's not an experience to savour.
So anything that reinforces taking the emotional component out of the decision-making and reduces it to a process is to be welcomed.
Spirax Sarco are just down the road from me, and have a glorious worldwide dominance in their field. But they have never (in my investing lifetime) been at a price I could bring myself to pay. To my cost, as the chart shows.
I look forward to your next piece, telling me the exact moment in the process to press the sell button . .
Jon
Oversimplistic. And therefore memorable. And genuinely helpful. A great article.
Brilliant Mark thank you, there have been a lot of good articles this month, it's hard keeping up with them all but this shoots to the top of my list. All those questions swirling around in the confines of my overloaded mind are brought into clear relief with this article. I'm a QV type always asking myself questions about how to relate to Momentum. This content adds great value to my process of evaluating stocks before and during holding.
When you talk about averaging down with caution, do you have a definition, or set of rules, questions or parameters for making a buy decision on a holding under water? Conversely do you have any comments about adding to a holding of a value stock when price is rising?
Thanks TEIN,
That’s a good question, but also a massive question. I have a whole section on averaging down and some of the benefits and pitfalls in my book When it comes to averaging up then it really involves having a well-thought out way of position-sizing in your portfolio. (There is nothing magic about averaging up or down, the market doesn’t care about your buy prices!) Again something I cover in my book.
Sorry that this answer ends up being a plug, rather than direct help but it really is a massive topic that I probably couldn’t do it justice in an article, let alone a comment!
Mark
Love the strategy. Always good to have a reminder of the biases. I'm often held back from selling by the observation that new investors lose money by over-dealing, when I should just cut loose.
Question: what do you mean by 'diamond hands' and 'glass hands'?
The diamond hands comes from last year’s bonkers short squeezes of GameStop and AMC., it was an encouragement for others not to sell and hang on so that the stock could be squeezed. Glass hands was the name given to those who sold and weren’t able to hang on.
yes, glass hands or paper hands.
i think those now still holding AMC should refer to their own as sieve hands
A great analogy Mark and a very enjoyable read, thank you!
Mark,
This makes a good story but you have illustrated each step with a different company. As an example, I can't find any evidence that Spirax-Sarco Engineering (LON:SPX) has ever had a value rank above 40. Are you able to search the Stocko database and find half a dozen or so individual companies that have surfed the full wave, from start to finish? I think that would be fascinating.
Hi DWit199,
It's a nice idea, but I'm afraid I don't have any Jedi powers to make this sort of search possible.
Sorry!
I hoped you had a direct line into HQ and that they might be able to help. The story would be much more compelling with a few concrete examples.
Hi DWit199, thanks for your suggestion. We're going to open up the data vaults to try and find some examples.
Hi Megan, I think Reach might be a good case study for you. I am just looking at the relationship between the share price and StockRank, which seems to have been a good predictor on the way up and again on the way down. I have not looked at the individual components of the SR.
Buy in September 2020 when the Reach StockRank turned green (72.5p) and sell one year later when it fell below 80 (394p) would have been a great trade. Or you could have hung on and seen all of your paper profit disappear as the price returned to its starting-point...
Good luck in your search!
Mark, Great food for thought, thanks. I write-up a rationale for each of my purchases and set a price target. The rationale and price target are then altered as signals, not noise, subsequently become available. Not sure I ever get out at the top price, but I hope to remove some of the guesswork with my approach.