Hello everyone,
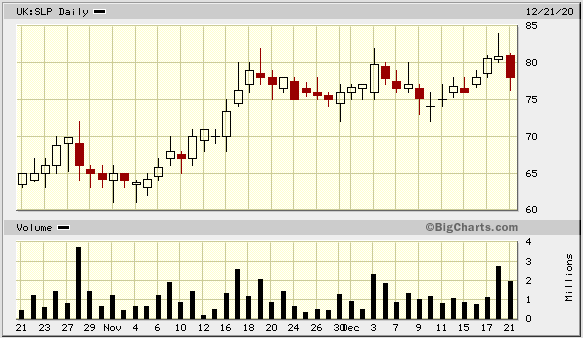
This is my first post here, and I'm sharing one of the stocks which I am considering to go long for the next couple of weeks. Over the past, I've traded a variety of different securities, but it was in fact this summer where my swing-trading activities went full time. Although I also used to day trade, I quickly realised that it was not as rewarding as swing trading, especially for the amount of time it used to consume. So, as I am swing trading with confidence now, I am willing to share one particular stock which I am seriously eyeing, and that is Sylvania Platinum (LON:SLP) (Sylvania Platinum). After having conducted a significant amount of research on here and on my charts through technical analysis, I believe there is good amount of upside momentum awaiting. However, there's a catch - and I'll discuss this later on, but for now, allow me to present a very nice daily chart of £SLP.
(Chart 1) - Indicators: Stochastic top, RSI (14) bottom.
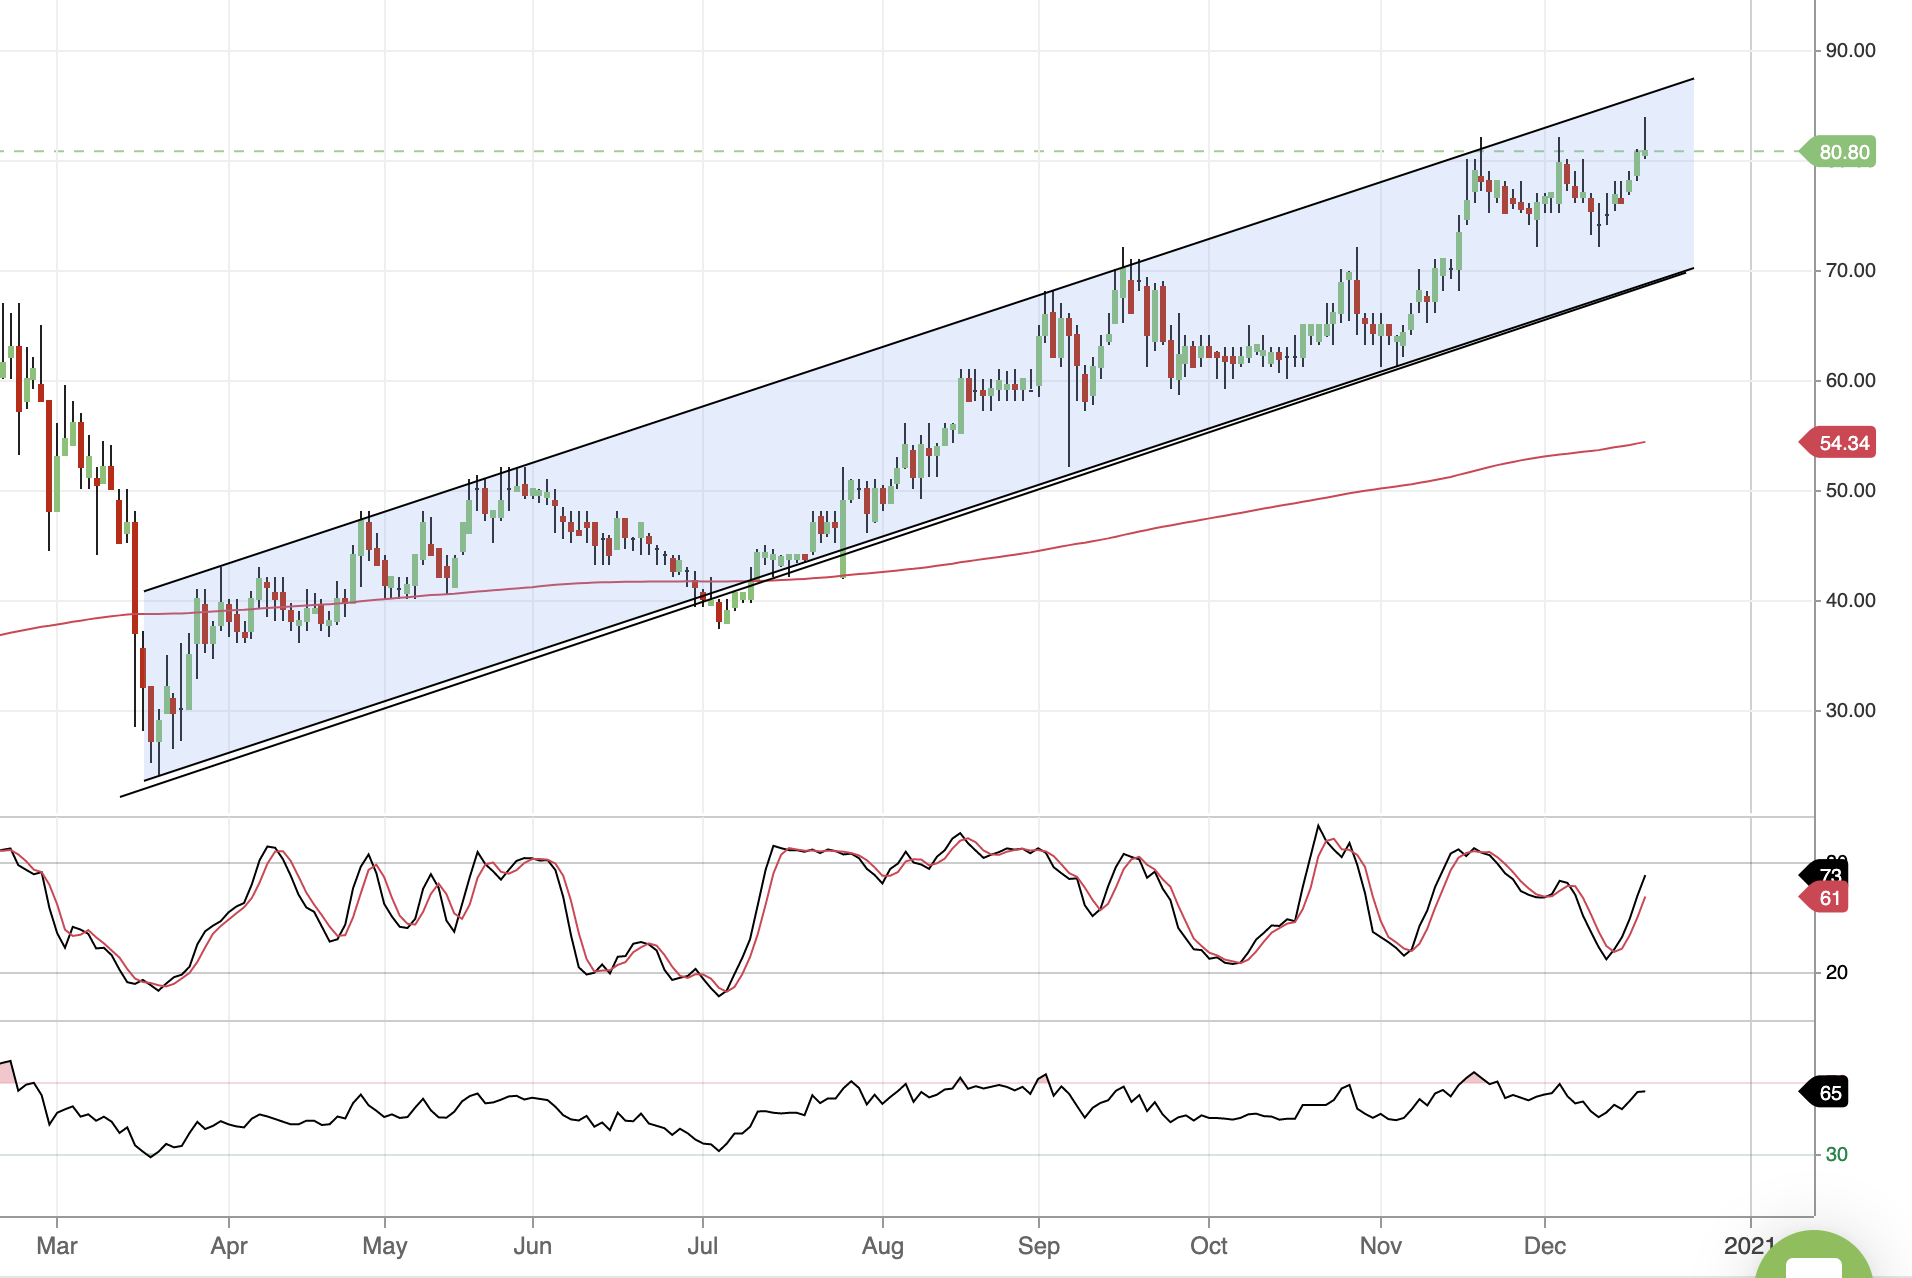
Here, you can clearly see that Sylvania Platinum (LON:SLP) has been trading within an uptrend channel ever since the crash in March. Given this channel, the stock has gained 231% since then. At first thought, you'd think that the stock would continue to go a little higher before touching that upper trendline. However - a continuous test of the 80.00p level suggests the pair may be overbought in the current time frame (daily). This is highly represented by the current levels in the Stochastic, RSI and Williams R% indicators.
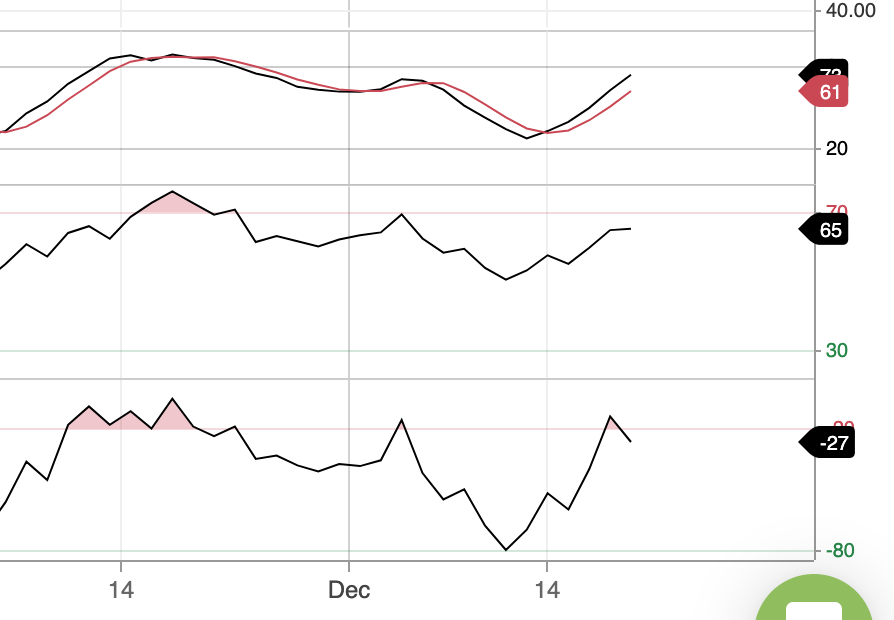
(Chart 2)
As presented by the chart above, the daily chart implies that the Stochastic (top), RSI (middle) and Williams R% (bottom) indicators all seem to have had their run for the past couple days. And this makes sense if you think about it, because the price is currently way above the lower trendline in the daily uptrend channel (chart 1). Therefore, I as say I am eyeing Sylvania Platinum (LON:SLP), I believe there is reason to wait until things cool down and these metrics are found to be sitting in the lower areas again. This does not mean a pullback of large magnitude, but the price action may follow what the uptrend…