Welcome to the new Technical Analysis Series from Stephen Hoad. Stephen is the Technical Strategist at Stockopedia.com and he’ll be publishing a library of technical analysis resources over the next few months. We're hoping to launch some courses together in due course, so let us know how you find the content in the comments below.
This series will comprise 25 introductory articles covering all aspects of technical analysis, from the very basics through to some more advanced theory. Hopefully, these articles will whet your appetite for the subject and inspire you to take up technical analysis (if you haven't already) and use it in your trading and investing. My aim is to enhance your existing knowledge and give you an insight into how technical analysis can be used as an effective trading tool, both to make and save you money and give you new roads to follow. This is a vast, often misunderstood subject, so the aim of this blog series is to make it more accessible by breaking down a few of those boundaries.
In this first article, we explore the roots of technical analysis. It is vitally important for you to understand where technical analysis has come from and the thinking behind it, if you're ever going to successfully use it in practice.
What is technical analysis?
Technical analysis is a very straightforward concept: It is the analysis of market activity (price, volume and open interest), predominantly through the use of charts, with the goal of forecasting future price trends. Many of the tools used in technical analysis can also be found in use in areas such as quantitative analysis and behavioural science. It is a very flexible, adaptable, multi-time dimension frame approach to trading and investing.
Technical analysis is built on three pillars:
1. Market action discounts everything i.e. the price is the price - you don't need to necessarily know how it got there, other than supply and demand made it so.
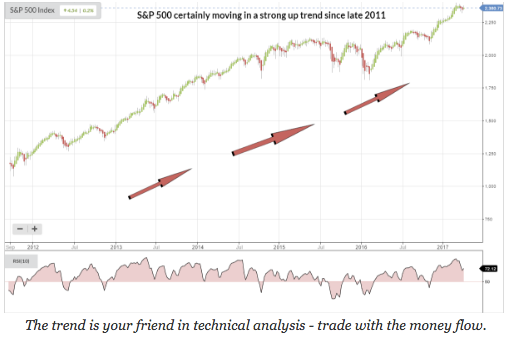
2. Prices move in trends
The S&P 500 is a great recent example of a price trend - why would you go short in the longer term if you saw a chart like this?
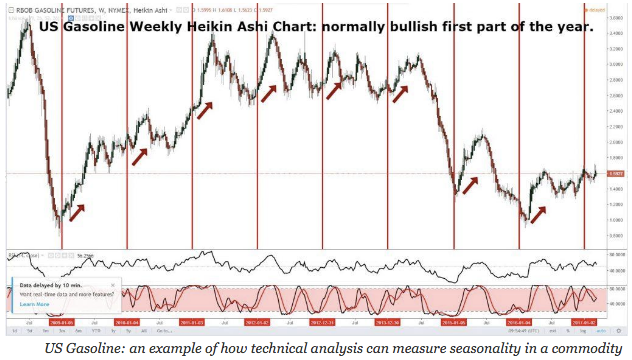
3. History repeats itself
Historically, US gasoline is repeatedly bullish at the start of the year:
Technical analysis is very different to fundamental analysis. Fundamental analysis is all about value; is something fair value, under value or over…