Part 14 showed us how useful and effective Pivots could be, especially for intraday trading. Part 15 introduces us to a very individual concept in technical analysis. Ichimoku is a unique trading tool for analysing any asset in any timeframe. To the outside observer, at first glance it looks a complete mess. Untangle it though and you have a straightforward and very powerful all round trading system that can seriously boost your trading results.
This blog presents a simple overview of this system, building up the tools of Ichimoku using the S&P 500 Stock Indices as the base example, hopefully giving you an initial starting point on your journey into a unique part of technical analysis.
'One look'
Ichimoku, otherwise known as Ichimoku Kinko Hyu, was developed by a Japanese journalist Goichi Hosoda and published in his book in 1969. It means ‘one look’. It is a collection of technical analytical techniques to determine:
The trend
Momentum
Support and resistance
Trading signals
Entry and exit points
Example: Typical Ichimoku set up on S&P500 Index (Charts: Stockopedia)
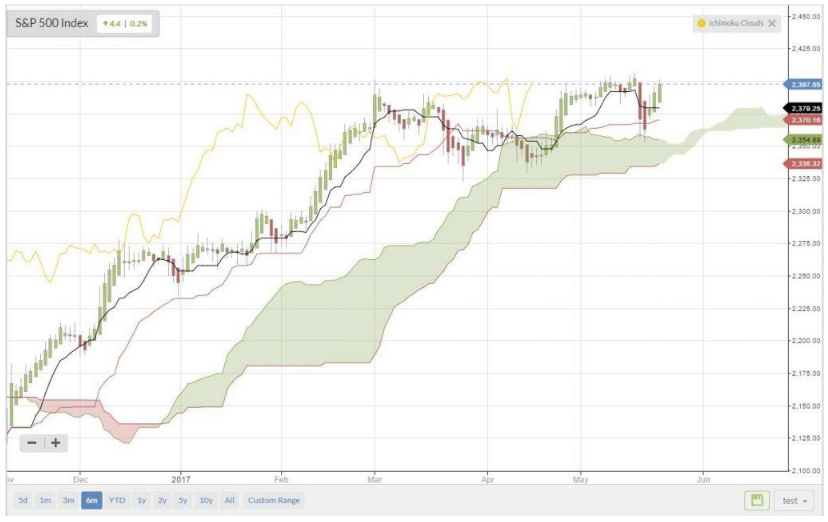
Ichimoku: a one stop trading shop!
The basic components of Ichimoku
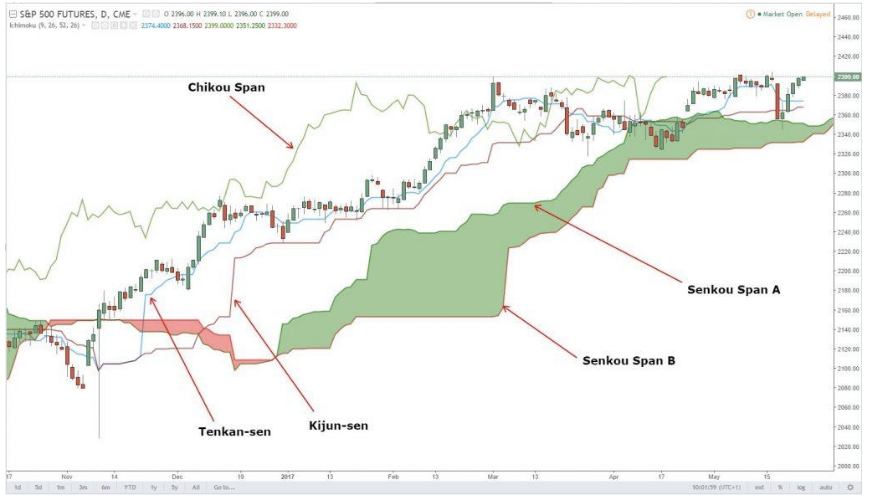
It is made up of 5 key parts. 4 of the 5 are based on the average high / low over a given period.
Tenkan-sen (Conversion Line): (9-period high + 9-period low)/2))
Kijun-sen (Base Line): (26-period high + 26-period low)/2))
Senkou Span A (Leading Span A): (Conversion Line + Base Line)/2))
Senkou Span B (Leading Span B): (52-period high + 52-period low)/2))
Chikou Span (Lagging Span): Close plotted 26 days in the past
The inputs above are the original default settings. However, there is nothing to stop you changing and adapting a different set up.
S&P500 Index (Charts: TradingView) with Japanese labels:
Ichimoku rules: The cloud
Senkou Span A and B form the shaded area known as the cloud, or to give its official name, the Kumo. The cloud changes trend direction when these two lines cross. In the example, here for clarity, green signifies bullishness and red bearishness (standard default colours in most chart packages). Again, there are no rules to say what colours you need to use. The cloud can be great for highlighting potential support and resistance levels.
There are two ways to identify the overall trend using the Cloud.
1. The trend is up when…