Previously, we looked at tools and indicators based around trend and momentum that confirmed price action. In this article, we will look at three further types of price confirmation tool: Volatility, Volume & Sentiment. These tools could help give you supportive, independent information in your analysis of any given asset. What is presented here, is not an exhaustive list of the technical tools used in this space, but some of the more generic and popular ones.
Volume
Volume is a measure of how much an asset has been traded in a given period of time. It can be a very useful tool to help confirm your price analysis. There are many volume tools, and we have already come across some in previous articles. For example, McLellan, Chailin and Accumulation / Distribution. Here we're going to take a look at On Balance Volume (OBV).
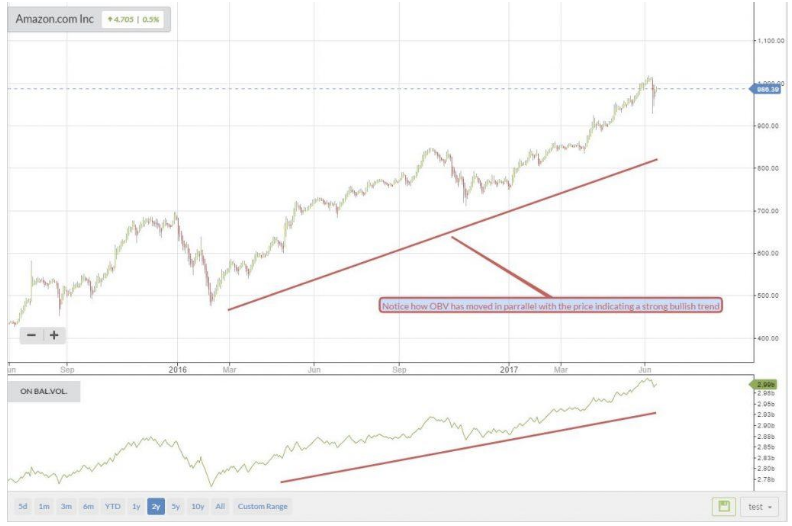
OBV is the total volume for each day, which is assigned a +/- value depending on whether prices close higher or lower for that day. A higher close causes the volume for that day to be given a +, while a lower close gets a -. A running cumulative total is then maintained by adding or subtracting each day's volume, based on the direction of the market close. The direction of the OBV trend is the key and not the values. If OBV is heading in same direction as price, this is a trend confirmation. When OBV diverges from price, this is a warning of a possible trend reversal.
Example using OBV for Amazon Inc (AMZN) (Charts: Stockopedia):
Volatility
Like with volume, our paths have already crossed various volatility indicators such as Bollinger Bands and ATR. There are also very obvious measures that can be derived from price, such as historical volatility based on standard deviation. Another popular indicator used is the Chaikin Volatility measure. Appreciating the volatility of an instrument, can be crucial for your trade and risk management and an understanding of how the asset you are analysing behaves.
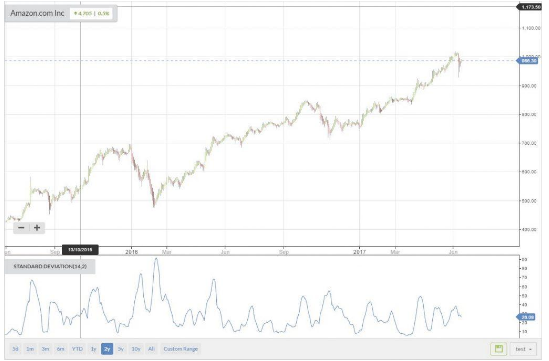
Example using the Standard Deviation tool for Amazon Inc (AMZN) to measure price action with a set up of 2 standard deviations on 14 daily periods (Charts: Stockopedia)
Sentiment
Sentiment is another area that you might want to look at adding to your technical analysis; often independently configured away from…