Last week in Part 4, we looked at candlestick charts. This week, we look at one of the oldest charting methods popularised in the West: Point and Figure charts. To some, Point and Figure charts look like a glorified game of noughts and crosses! To others they simply make no sense or serve no purpose. Unfortunately, the interest in Point and Figure charts is on the wane, which is a shame because if you dug a little deeper, they can be a highly effective charting approach that you could use for your trading and investing. They can offer flexibility and a different perspective on price action.
Point and Figure history
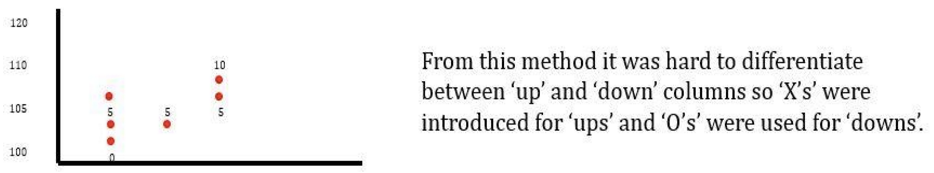
This style of charting has been around since the 1880’s and pre-dates the bar chart. It started as a tick by tick charting system developed out of a practical need to record market prices on the go. Traders developed an efficient system to record prices, taking out previous very tedious methods of recording. Its beginnings were in a system that plotted price points between a set range and when the price points hit the range, the number was illustrated. This is where this method of charting gets its name from.
Point and Figure basics:
- It is the study of pure price movement i.e. it doesn’t take into consideration ‘time’ when constructing its charts (although most charting packages leave 'time' on the X axis).?
- Only price changes are recorded. If there is no change then the chart is left untouched.?
- Point and Figure ignores volume numbers – volume in effect is represented differently i.e. through the activity of the change in price on the chart. The heavier the activity, the more changes are recorded.?
- The sensitivity of the charts can be varied to provide short / medium / long term charts all off of the same data.?
- Point and Figure charts are very good for finding support and resistance.?
- Recording price moves on Point and Figure charts is a very different process to bar charts. It uses columns of X’s and O’s. Again: X’s = Up moves / rising prices, O’s = Down moves / falling prices.?
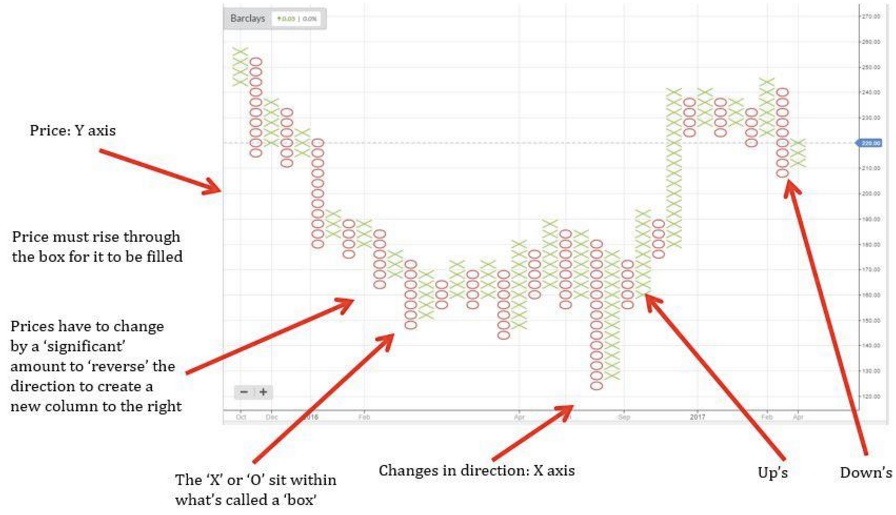
- The chart has two basic parameters: Box Value and Reversal Criteria. You would change these to increase / decrease the sensitivity of the chart and the amount of trading signals you’d get.?
- Increasing the box size offers…