Last week in Part 8, we looked at Trends, Support & Resistance. We take those ideas one step on this week, into the concept of patterns on price. Many think pattern analysis is created from a mystical land and disregard it without a second look! There can be strange names associated to the various patterns and this probably doesn't help their legitimacy, but if you stop and think what the price is doing within these patterns, you can see the economics of supply and demand at work and this is why these patterns make sense and can be so effective.
The purpose of chart patterns?
Their purpose is to organise price movement into two buckets - prices that continue and prices that reverse, with the aim of giving the user some clues as to what the price will do next. When a trend is developing, it normally has a period of time when it evolves into one of these two camps: reversal or continuation. This evolution into its future direction is captured by price patterns.
What are they?
They are simply pictures or formations of price which appear on your price chart in any time frame, whether it be FX, Commodities, Stocks etc, that can be classified into different categories that have some predictive and probabilistic value.
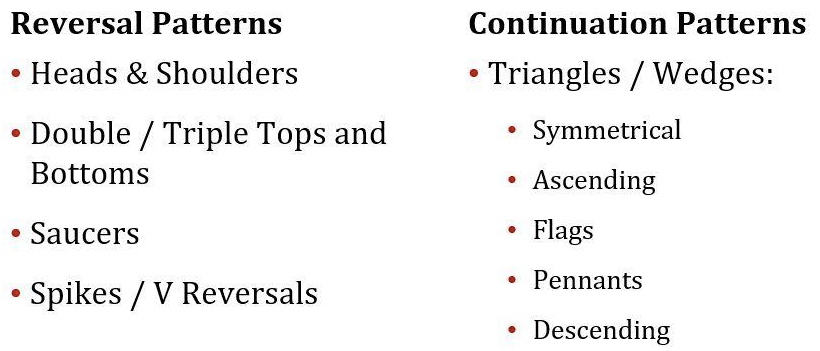
Under the two main camps of continuation and reversal, they are split further down into unique individual patterns:
Reversals
We will take a look at a couple of those reversal patterns - the double bottom and the head & shoulders:
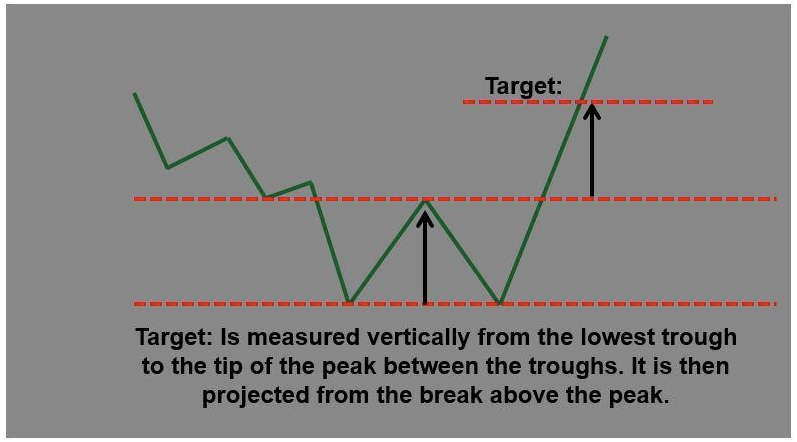
The 'double bottom': named because of its 2 touches on the resistance line, aka the 'W'.
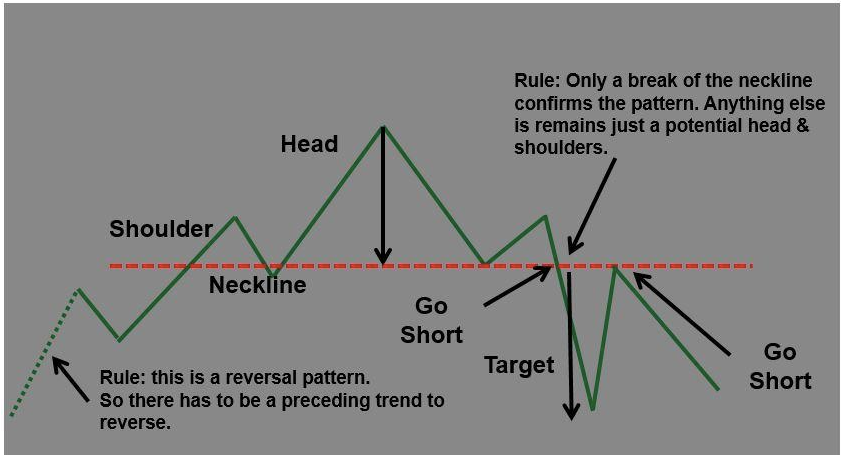
The 'head & shoulders': another obviously named pattern, simply from the way it looks.
Rules of the reversal
There must be an existence of a prior trend coming into the reversal pattern.
First signal of reversal is often breaking an important trend line.
The larger the pattern, the greater the subsequent move.
Topping patterns are usually more volatile than bottom patterns.
Bottom patterns have similar price ranges and take longer to build.
Reversal points normally coincide with heavier traded volume.
Volume is usually more important on the upside.
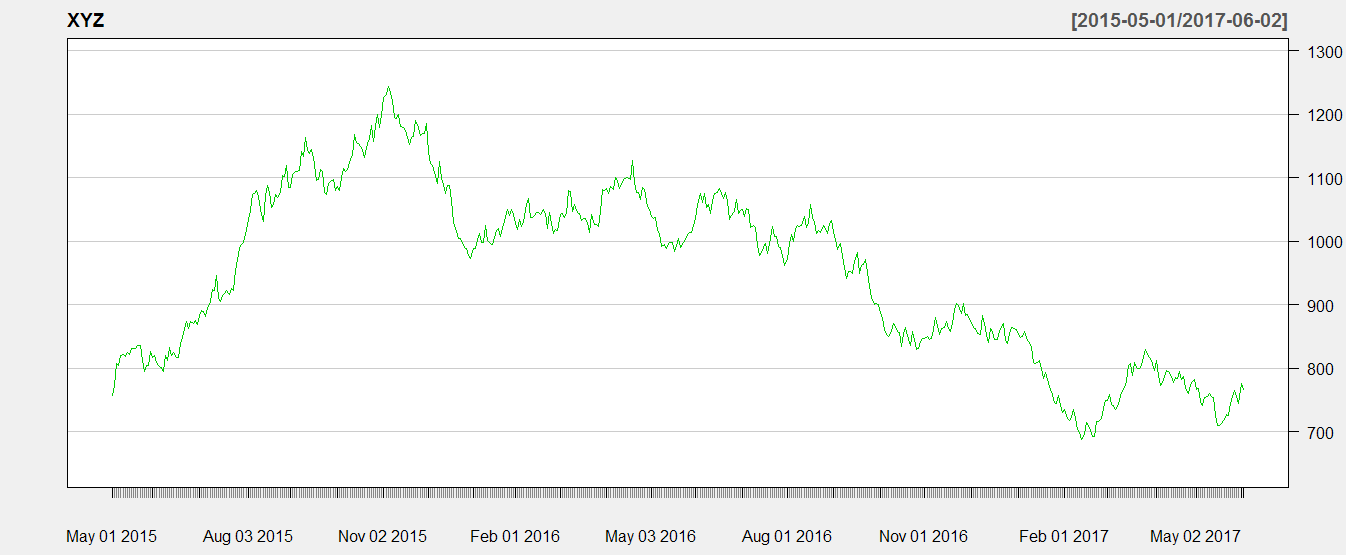
An example of various patterns playing out on WTI Crude Oil (NB. The drawing of these patterns IS…