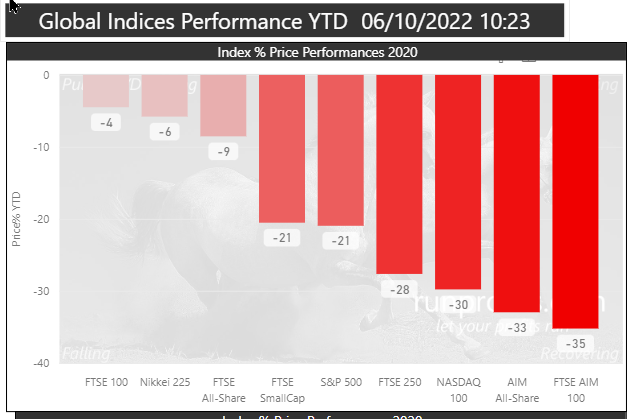
It's been a pretty brutal twelve months for everyone investing in stock markets - not only here, but all around the world. But one area of optimism has been the performance of the UK broader benchmark - the FTSE All Share.
According to my measurement, the FTSE All Share has fallen by 6.2% over the last 12 months since October 4th. Given the index has yielded 2.77% over that timeframe, it's been pretty robust in what have been very difficult markets.
But most of us are down 20%+ in this timeframe. Some subscribers have written in who have constructed their portfolios using 80+ ranked stocks and asked why the they are underperforming the FTSE so badly.
It's a good question... but are we really underperforming?
Value Weighting vs Equal Weighting
One of the most vital things to get your head around when assessing an index's performance is *how the positions are weighted*. This has a huge impact on the reported returns.
* Value Weighting - often called "market capitalisation weighting" - is weighting each position relative to the total value of the company's shares (market capitalisation). In this way Shell (at £161bn market cap) will we weighted almost 12,000 times larger in the index versus Made.com (£13.7m market cap).
* Equal Weighting - this is the process of weighting each position in exactly the same size. So Shell and Made.com would have the same weights.
Most benchmark indexes use Value Weights (Market Cap Weights) for their construction. There are huge benefits to doing so as it's so much cheaper for product providers (like Vanguard, iShares etc) to build investment products around them. In a value-weighted index fund, once a position is bought, it doesn't need traded again. It's buy and hold forever, or until a stock leaves the index. Equal weighting on the other hand requires regular rebalancing of position sizes, so is more expensive to operate.
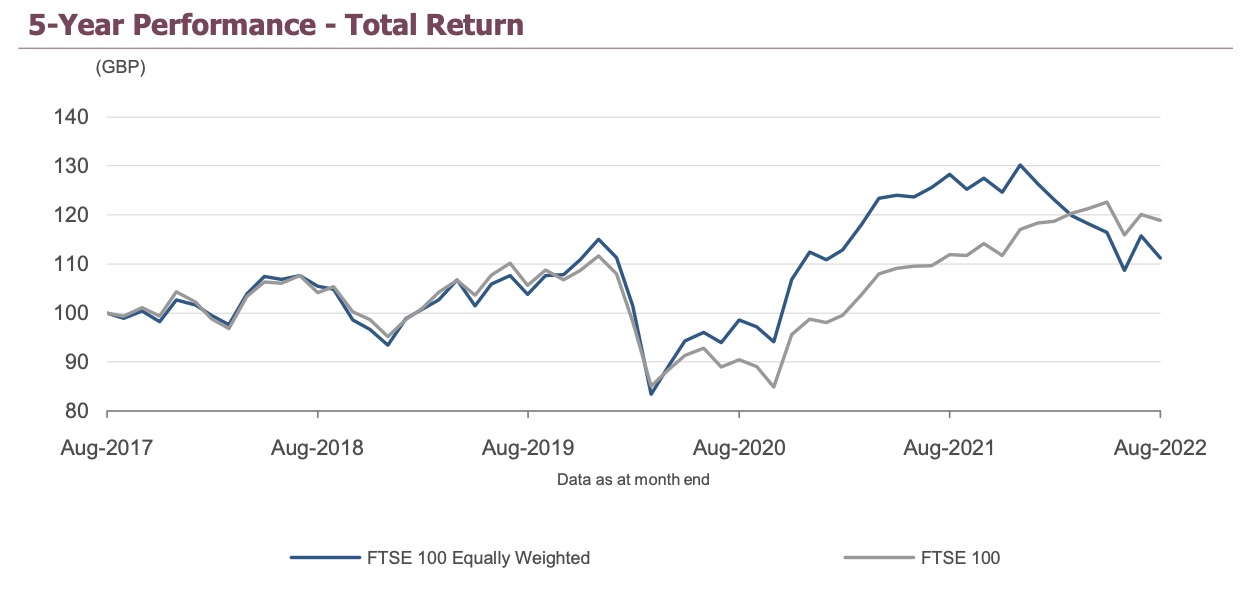
The equal weighted performance of the FTSE All Share
One useful feature on the site is the 'simulation charts' that we provide on watchlists. These create an equal weighted portfolio of shares from all watchlist constituents 12 months ago and track the performance forwards. It provides a quick measure of the difference between equal and value weighting below.
I created one quickly by copying in all the FTSE All Share constituents. In the chart below you…