The madness of crowds? Why you should avoid Hargreaves Lansdown's most traded stocks

Hargreaves Lansdown is one of the UK’s biggest investment brokers - and like other platforms, one of its eye-catching pages is its "Top of the Stocks" feature. You may have perused lists like this for interest or even made investment decisions off the back of them. But have you ever considered what lists like these really tell you - and whether they’re a route to easy profits or painful losses?
Lists of the most viewed, most bought, and most sold stocks can instinctively feel like a useful guide to what’s hot in the market. But our research shows that far from being a useful short-cut, these lists are right to carry very serious wealth warnings…
Hargreaves’ homepage reveals the top 5 most viewed shares and just one click away you can find the top 10 most viewed shares. This may seem innocent enough, and perhaps even very useful. After all, given the concept of the wisdom of crowds, the top 10 most popular shares could easily feel like somewhere you should be focusing your attention.
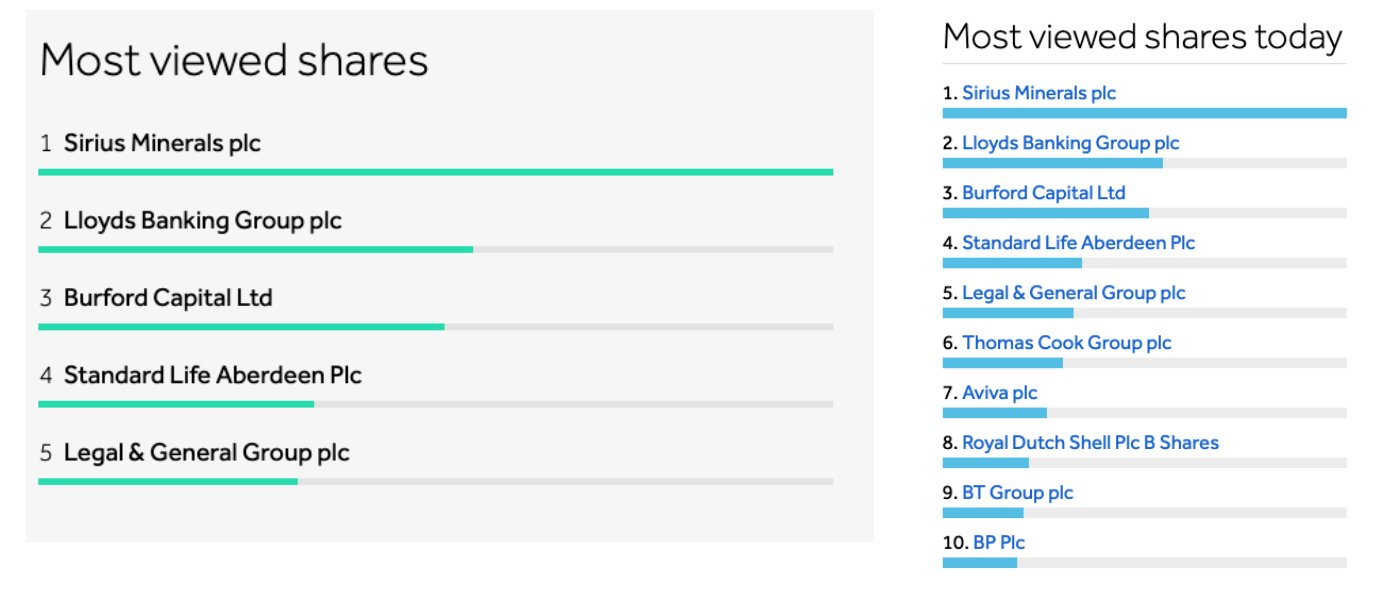
Well, that’s where you’d be wrong. Upon seeing this list, there are three actions you could realistically take.
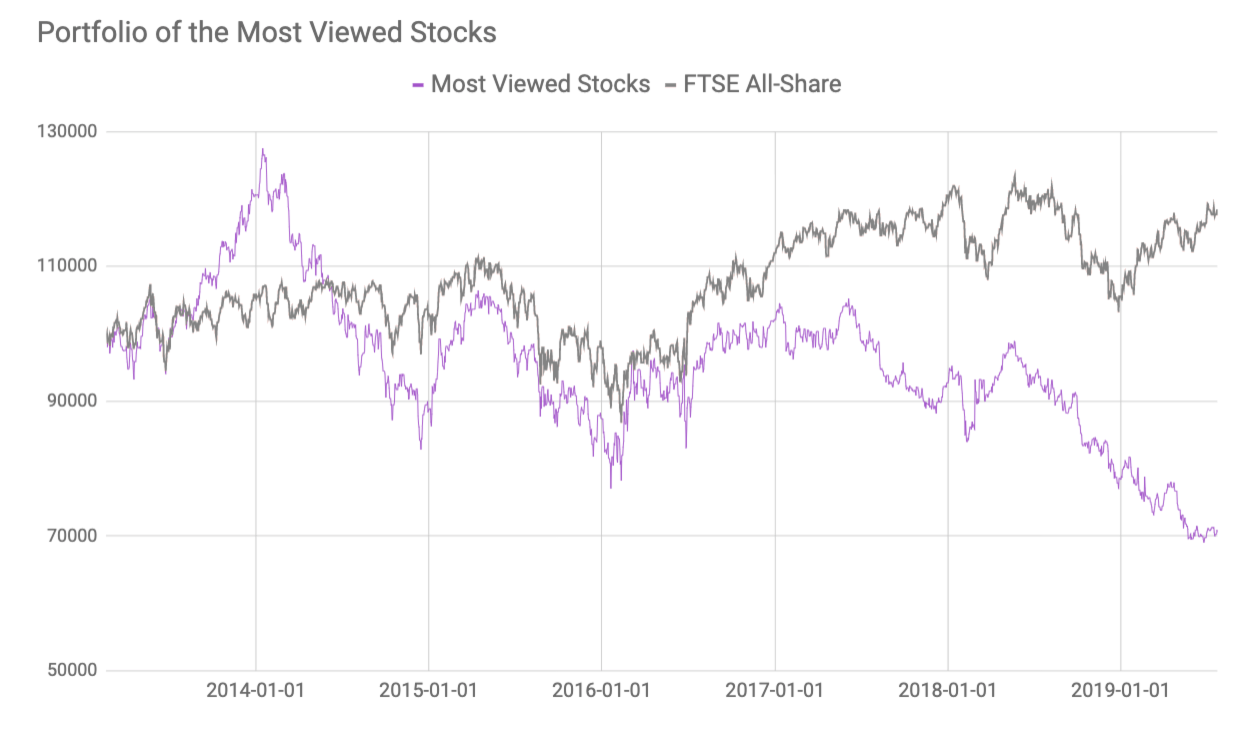
1. You might trustingly decide to buy these stocks, rationalising that they should perform well as they might have strong momentum. You may reasonably think that you can even combat poorly performing stocks on the list on any one day by adjusting your portfolio quarterly or even weekly. Yet my research shows that even this will not be able to save you from poor portfolio performance.
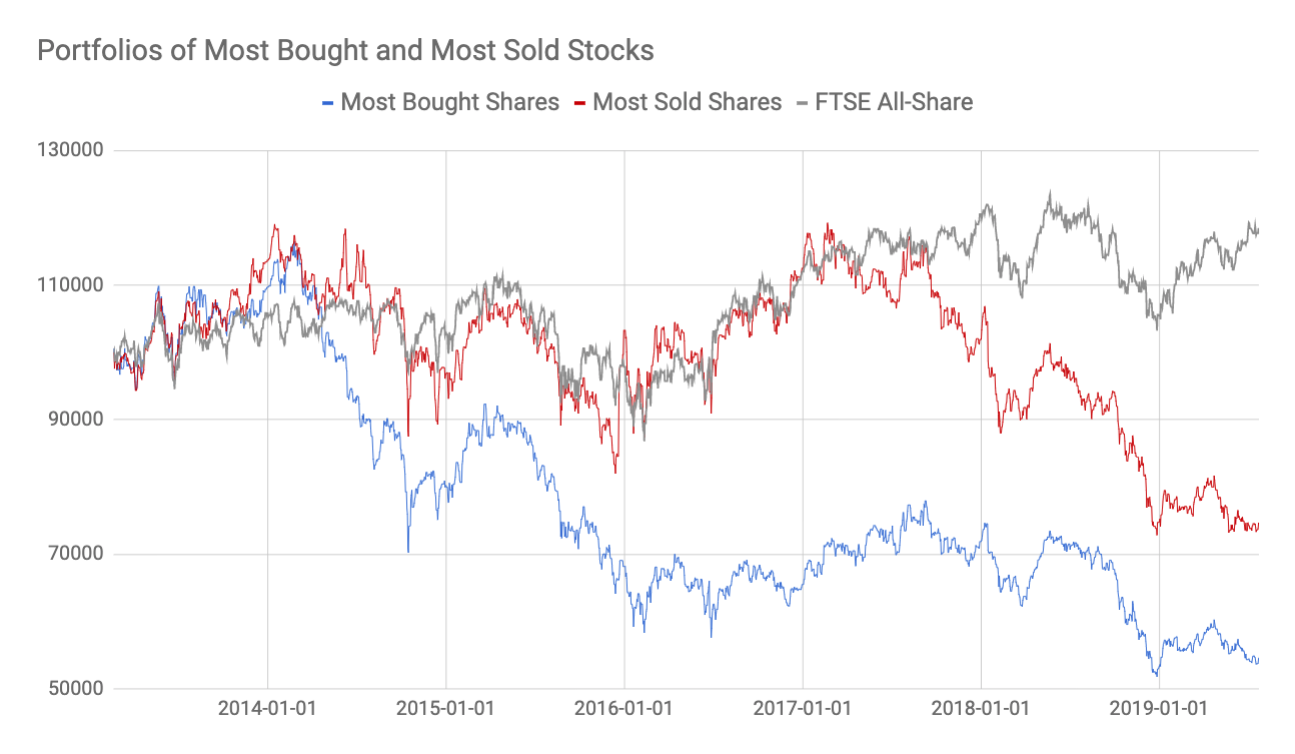
Using the top 10 lists dating back six years, I have created a portfolio of these stocks and updated it quarterly (in January, April, July and October), graphing the performance in comparison to the FTSE All-Share Index. Both are given a base investment of £100,000 and rebalanced quarterly as and when there is new data on stocks. As demonstrated, such a portfolio would significantly underperform the FTSE All-Share Index.
2. You might decide to do some research to determine whether or not the stocks are worth the hype. Perhaps you think there must be some reason for the popularity of these stocks and know to do your research before investing. Investors should, on the whole, be smart and rational. However, given the data I’ve collected about these stocks, there are strong indications that most, if not all the stocks, are potentially hyped and actually poor stocks to invest in.
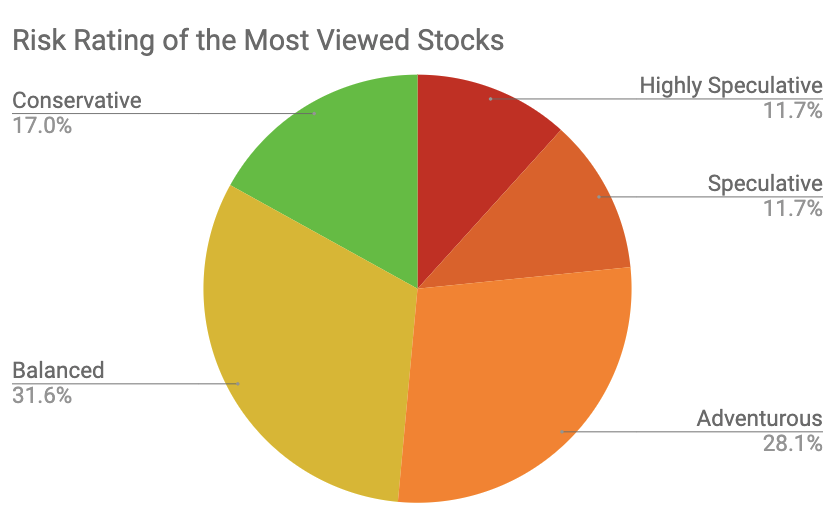
Nearly a quarter of these stocks have a Speculative or Highly Speculative RiskRating (the two highest volatility bands on Stockopedia’s RiskRating spectrum). They have an average Piotroski F-Score of just above 5 and an average StockRank of merely 60.5. Although these aren’t damning figures on their own, they do suggest that the stocks are not as strong as they could be. Instead, you could have been screening for only the stocks expected to show the strongest performance via Stockopedia’s "Popular Screens" section.
3. You might ignore the list and go about your investing as usual. Good for you, you’ve avoided the trap of being a sheep and following the crowd. Now you can gloat about how you haven’t been lured into creating badly performing portfolios or researching poorly performing stocks.
It’s not only the most viewed stocks you should be wary of…
So, a portfolio of the most viewed shares could well lead you to a loss. But what about the kinds of most bought shares that you find in lists like those in Hargreaves’ “Top of the Stocks” section?
I mentioned in the beginning that there is not just the most viewed shares section but also the “Top of the Stocks” section, which shows the most bought and most sold stocks weekly.
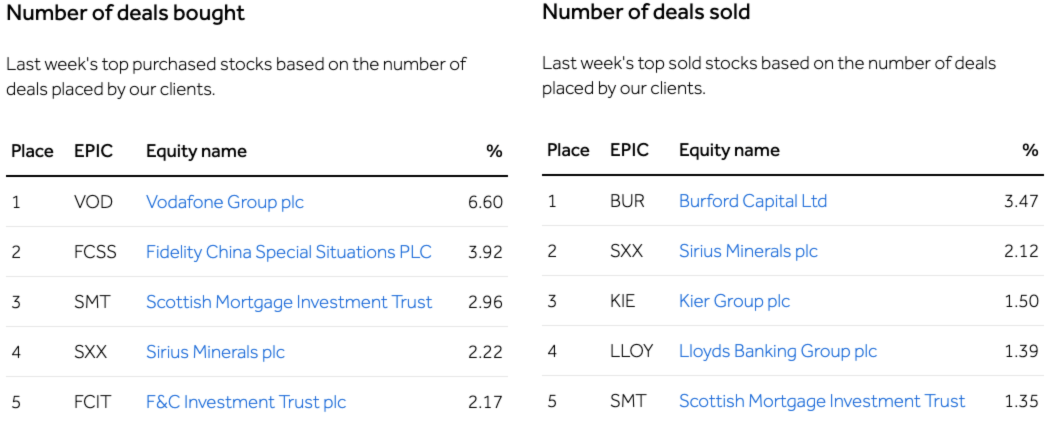
You can find Hargreaves’ “Top of the Stocks” lists under their ‘Shares’ section as a further subsection under ‘Research and Tips’. Here, I would argue that these lists are neither research nor tips. There is no research going into these shares; they are merely compiled from the shares which most of Hargreaves Lansdown’s clients bought or sold. They also should not be classified as tips; as mentioned above, if investors were to blindly abide by these lists and buy the relevant stocks listed, their portfolio would underperform the FTSE All-Share Index even more than if they had bought the most viewed stocks.
A damning final finding here - one that really reinforces the risks of following the crowd - if you had chosen to buy the top 20 most sold stocks, updating your stocks quarterly, you would have notably outperformed an investor choosing to buy the top 20 most bought stocks across this same time period by over 20%. This kind of result shows just how easy it is to waste time, lose money, and adopt poorly performing strategies in the stock market.
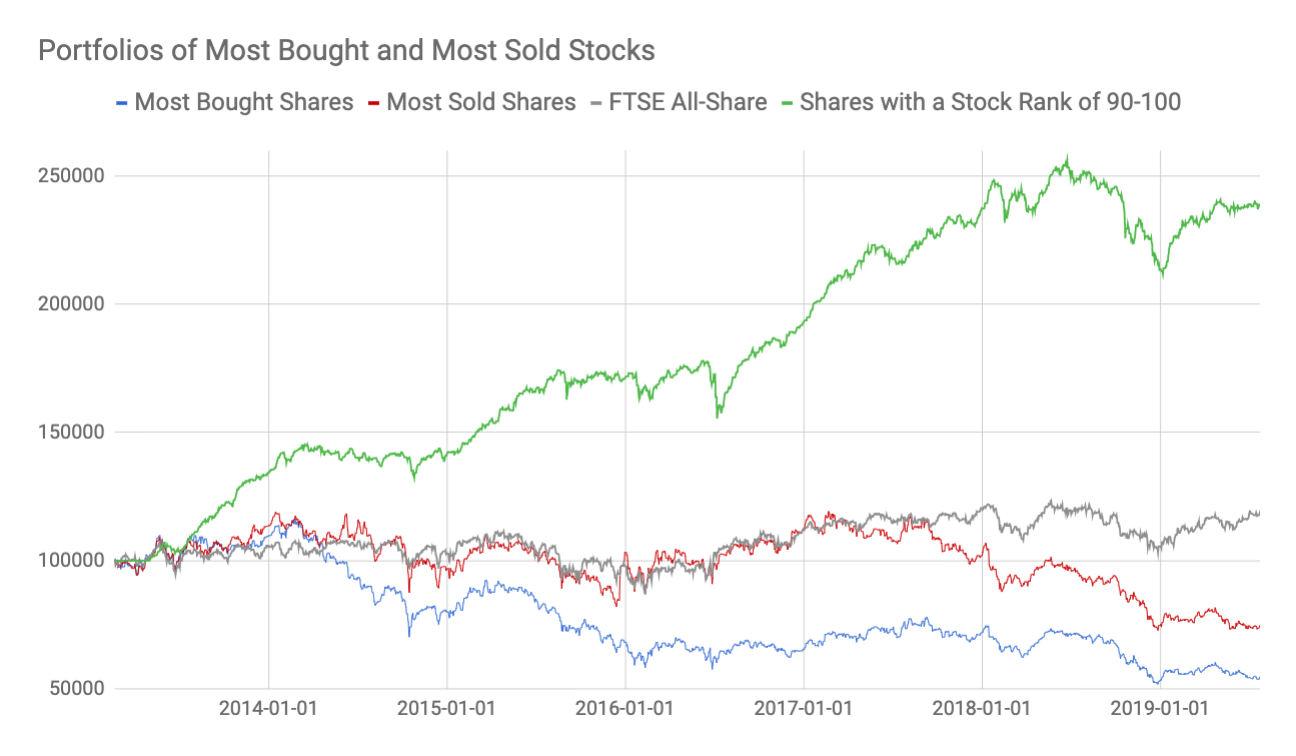
In comparison, if you overlaid the performance of the stocks with a StockRank over 90 during this same period, you would find that it outperforms the FTSE All-Share Index by over 120% and the portfolio of the most bought shares by over 180%.
What Stockopedia’s data tells us about the most bought and most sold lists
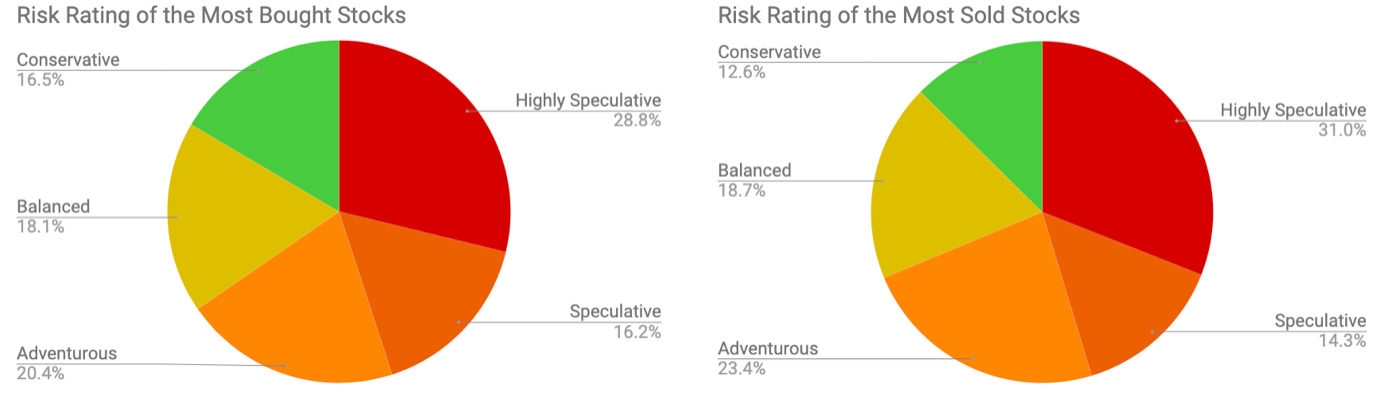
First of all, how do the stocks on ‘top lists’ rate in terms of historical volatility? Simply by looking at the Risk Ratings of both lists of stocks, you can see how speculative most of them are. In fact, 45% of the stocks in the most bought lists are Highly Speculative or Speculative in comparison to 45.3% of the stocks in the most sold lists. It seems that retail investors appear to be attracted to volatility rather than stability when investing.
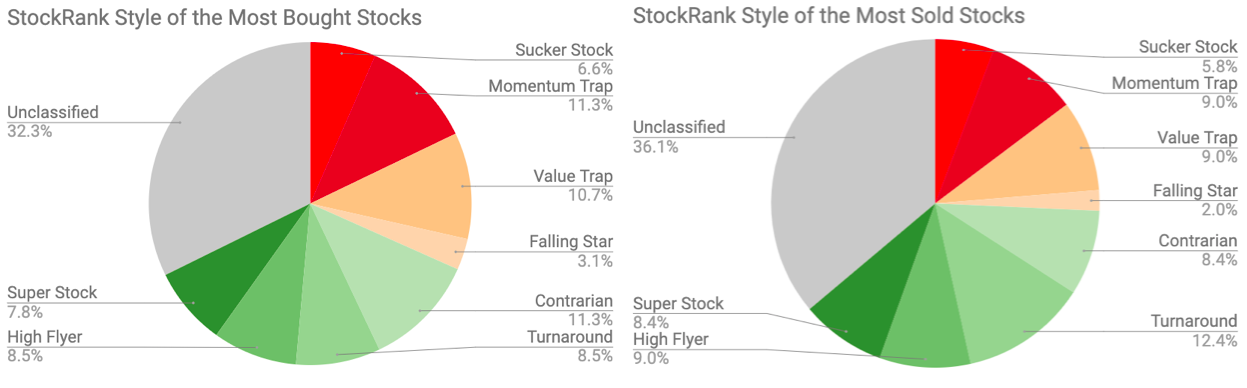
Secondly, in terms of factors like Quality, Value and Momentum, what kind of profile did these stocks have? According to the StockRank Style, 31.7% of the most bought stocks are of a losing style compared to only 25.8% of the most sold stocks. So, if investors had used Stockopedia’s website to research the StockRank Styles of the stocks in these lists, they could have easily avoided investing in badly performing shares.
What can we learn from all of this?
The data clearly demonstrates that ‘top lists’ attract a lower quality of shares. Very importantly, it’s not just Hargreaves Lansdown that publishes lists like this. You can find them on broker platforms and media outlets everywhere. And while they do offer a snapshot of market activity that can be useful to many, those inclined to use them for trading ideas could well be pursuing low probability bets.
Lists such as these merely add noise to an already noisy environment; investors already have so many signals they could respond to. Now, they need to know which are the correct ones to listen to. In this case, if you thought that these popular stocks lists were well researched or that the crowd should be right, unfortunately, you’re incorrect. Not only that, but you could do real damage to your portfolio.
Perhaps instead of ‘top lists’, consider using Stockopedia’s range of factor-based screens based on well-researched criteria that have proven results.
Disclaimer
This is not financial advice. Our content is intended to be used and must be used for information and education purposes only. Please read our disclaimer and terms and conditions to understand our obligations.
33 comments
Thought-provoking and direct. Of course maybe HL could make it even clearer that these lists are for information and interest only but definitely not recommendations. Indeed HL rarely give advice unless the client specifically requests it though their comments section is a useful starting guide prior to DYOR ,preferably through Stockop.
An excellent piece of research and an interesting read.
I wonder if anyone has done any research into the performance of unit trusts recommended by Hargreaves L compared to their underlying sectors - I have been increasingly of the opinion that there are some very ropey contenders in their recent recommendations for Wealth 150 (now 50), having plotted a few against other trusts in the same sector as those recommended... including, of course, funds managed by Woodford.
The question to ask is "why is this stock in the most viewed/traded list"?
The reasons differ. Having a large shareholder base is obviously one. Lloyds with its huge Halifax shareholder base (due to de-mutualisation some moons ago) is one, BT with its massive staff share programme is another.
The sheer size of the stock capitalisation is another reason why there may be so many shareholders. e.g. Vodafone, Lloyds, BT.
Then there is "being in the news" - Burford ticks the box on this one with its fall from grace and consequent fear. Others will attract the greedy as speculative plays like miners.
So, given there are real reasons beyond company features as to why the companies may be in the lists, I'm not sure you can draw many inferences.
Good article Zoe, highlighting the danger of following the crowd!
However I must come to HL's defence and say that these lists are not share recommendations or buy tips. As you mentioned in one of your responses: "I’m not testing stocks promoted today against historic data but stocks promoted historically against the relevant historic data." HL does not promote these lists as buy or sell recommendations they are there purely for information purposes on the most traded shares on a given day.
I think you raise an excellent point in this article though in that following the crowd rarely results in outperformance! The StockRanks are a much better tool to help select winning shares!
Great piece of analysis, thanks Zoe.
I don’t doubt the overall trend here. But to offer a partial defence of HL users.... there may be a small portion of them who use the platform for their speculative bets. They have their safe money invested in funds elsewhere, and use broker platforms for stocks they choose themselves, which are normally the “fun” ones with perceived large pay offs.
Admittedly that won’t be everyone - probably a small portion - but it would make the overall figures worse.
Nevertheless, you can’t disagree with the overall message. Treat any stocks on these lists with caution and do your research!
The list published by Hargreaves Lansdown are as much use as a chocolate tea pot.
Further, the research published by Hargreaves Lansdown is superficial and targeted at zombie investors.
The only technique for identifying shares to buy and those to sell has to be factor based and based on comparison of different stocks.
The reader is strongly advised to refer to Charlie Munger's Investing Principles Checklist as available on the Stockopedia web site.
Hi Peter
I give in, will you tell me where I find the checklist please?
Thanks
3rd Man - Searching Stockopedia (using the search box at the top of the page, in the middle) for “investing principles” finds a few things including this https://www.stockopedia.com/co...
There is no information on Stockopedia on market strength, positioning and innovation/R&D. So if you want to trash these top bought/sold lists I suggest you drop your momentum screen and concentrate on financial, economic and market fundamentals - this would make Stockopedia extremely valuable as a tool.
@Nicholas - yes there's a lot of factors we can continue to add, and do have plans to add.
Odd though to associate most bought/most sold with the momentum factor. Momentum is the strongest anomaly in finance... and it's outperformed the more pure 'fundamental' factors Quality and Value since inception.
The below is based on annual portfolios across the deciles... it's a few weeks old.
The emotional investor would rather buy a new low than a new high, except for after a long period of out performance where Fear Of Missing Out kicks in. The emotional investor will tend to sell at a new high, and potentially buy back higher, generating further momentum. The emotional investor will tend not to sell losers until the point of maximum despair. They might even refuse to take a loss at all. The emotional investor will fold a recovery at their break even. Finally the emotional investor loves a good story, especially one that involves them getting richer.
What doesn't help the London market, and thus the UK investor generally blind to the rest of the world, is the paucity of genuine secular growth companies; were they to exist the buy lists would probably look somewhat better, perhaps showing a high beta rather consistent awful performance.
have you ever read thinking fast and slow, it talks about anchors, if a company is well below a previous price it maybe cheap or it maybe a deteriorating crap stock.
To break free of anchoring is really hard to do, shops do it all the time in their 'reduced from' promotions (30% off 60% off etc), it gets your attention, the product wasnt worth it at the original price and still may not be at the reduce price but you find yourself comparing the two prices and nothing else
I fell for it before reading the book, I brought Mulberry based on its blown out price, however since i did its done sod all, i think i've fallen for the anchoring bias
Hi Zoe,
A fascinating piece of research, thanks for your hard work on this.
The main takeaway from this, that this lists should be used with great caution (if at all), is a good one.
However I draw some very different conclusions on some of the more detailed points.
The most viewed list
You characterise the most viewed list by observing that nearly 25% have a Speculative or Highly Speculative risk rating, an average F-Score of just above 5 and an average StockRank of merely 60.5.
But, consider this :
So the list manages to select a group of stocks that are slightly better than average (on the scores) and yet manages to significantly underperform the market over the test period – why should this be?
One conclusion could be that, the interest of the masses in these stocks, tends to mean that the price is over inflated at the time of initial observation – there may well be something in that.
However, I would conjecture that stocks often make this list (most viewed) because they have experienced some profound news (either positive or negative). If so I would expect there to be a much wider spread of outcomes (big gainers and big fallers) than the market as a whole. It would certainly be interesting to see if the data bears this out.
Performance versus the market has certainly been very volatile. There was substantial out-performance in late 2013 / early 2014, followed by significant underperformance later in 2014. (How much of this difference is driven by the outliers?)
By early 2016 there wasn’t much to choose between the list and the market in terms of cumulative performance, in fact the first three years look to be nothing but random. The list has done poorly since, but particularly in the last 12 months – is there a particular factor driving this?
Most bought and most sold lists.
It does not surprise me much that the most bought shares have underperformed the market (and that looks to be fairly consistent over the period)
More interesting perhaps is that the most sold stocks pretty much tracked the market until mid-2017, but have dramatically underperformed in the last two years. IE the masses were selling fairly randomly early in the period, but have recently ‘learned’ to sell the right stocks (but still buying the wrong stocks) . Again it would be interesting to understand if this is just random chance, if outliers drive the average or if there is something else we could learn from.
I do not think the fact that 45% of the buys and sells are from the two most volatile categories is particularly meaningful given that the market average is 40%.
Neither does the distribution of StockRanks styles look particularly profound. Across the market as a whole the distribution between winning styles, neutral styles and losing styles is roughly in thirds and both the buy and sell lists match this pretty closely.
So whilst it may seem intuitive that “if investors had used Stockopedia’s website to research the StockRank Styles of the stocks in these lists, they could have easily avoided investing in badly performing shares.” I would not take that for granted as a fact. I do not dispute that the StockRank styles are predictive across the whole market, it should not be assumed that this automatically applies to a subset – it may even be that the SRs ‘interact’ with investor sentiment actually produce perverse results.
Rather for me the take-out would be to totally ignore these lists (in fact probably never look at them in case you are subconsciously influenced) and simply use the StockRanks to characterise. The one exception to this might be to routinely avoid the “most bought” stocks as they do look to systematically underperform.
Great piece of research. Thanks Zoe. Although to be fair to HL if you move across to the top 'most looked at' funds, Lindsell Train Global is number one on the list so they're better at highlighting funds than shares (so long as one overlooks their recent predilection for Neil Woodford...)
Zoe, clearly a lot of work has gone into this and I thank you for it. It proves once again that the formula has to be Quality, Value and Momentum which results in a high stock rank. I think we all make life difficult for ourselves searching for the elusive best shares to buy now when the Stockopedia algorithms have crunched the data for us. Thank you again. When will I learn to accept the stock ranks and spend less time at my computer and spend more time enjoying myself on the golf course? Charles
Really interesting, thanks Zoe :)
Thank you Zoe for this very thought provoking and interesting piece of research, much appreciated from a novice investor. ATB David
This seems like a really well put together post Zoe, I doff my cap.
But I did have a question about it. Surely if HL are saying these stocks are currently 'most viewed', 'bought', 'sold' etc they're referring to now (the present day), and not 10 or 20 years prior as you've backtested? As you know a stock might not have been a good buy last year, but this year it could be coming into its own. So is it actually a fair test to compare these lists of stocks based on historical performance? Surely they're on the list because of their current fundamentals/data as of the present day. It'd be interesting to follow up on this in a year's time to look back on how they performed vs. the FTSE all share index for sure!
I might well be missing the point here, and in any case I found this an entertaining read, so thanks.
Thank you! I agree with you; the way I constructed the portfolios was taking a historic date, say the 9th of October 2016, and looking at what stocks HL had on its top lists on that day then using historic data calculating how the stocks from those lists performed until the next date I checked HL’s lists. In essence, I’m not testing stocks promoted today against historic data but stocks promoted historically against the relevant historic data.
In that case I totally was missing the point :-) Thanks for clarifying. Good blog!
Thanks Zoe, the conclusions seem instinctively correct. Lists of shares that include: Sirius Minerals, Burford, Thomas Cook, show that investors are attracted to falling knives like moths to a flame. Everyone loves a good story particularly if it appears to be - on sale! Twitter also confirms this, as investors pile in on the story stock de jour. Problem is that most of these stocks have fallen for a reason and continue to fall, so that the bargain becomes a trap.
Definitely; thanks for this additional insight!
It is also interesting that £BUR appears top of the list of shares being sold, whereas I just happened to look at IG this evening and see that 96% of investors in £BUR are long. Whether that indicates a change in sentiment in the days between the above and today or, possibly more likely, that IG users have a different approach to HL investors, who knows.
I don’t think that the brokers like HL describe these as “tips” so I’m not sure why you mention that they should not be used as tips.
The other thing that occurs to me, didn’t we know already that on average PIs under perform the market. (I don’t recall what evidence has been produced for that in the past). This is just an example of that. It would have been strange to find anything different.
We know that sentiment plays a significant part in the decision making process for many investors and that investors do not act independently of one another. So, this doesn’t really fit the wisdom of crowds principles anyway.
However, good news! Using the Stockranks can avoid these problems. Well, that may be true while the Stockranks are only used by a minority of investors, but if the vast majority of investors relied on the Stockranks would they lose their edge?
I mention tips simply because the top of the stocks are under the category of ‘Research and Tips’, hence mentioning they should not be tips. The point of this article is to simply point out these lists do not allow for the curation of a strong portfolio, whereas if you used Stockopedia you could create a much stronger portfolio. Regardless of sentiment, the wisdom of the crowds principle still holds; in general, the aggregation of decisions and information within a group should outperform an individual, regardless of whether sentiment is involved.
Thanks Zoe, a very useful piece of work. It really does emphasise how many of HL's retail investors would benefit by investing first in Stockopedia rather than jumping into the market head first.
Seems to raise a lot of follow-up questions for me...
Why do most bought perform worse than most sold? The opposite pattern to what you might expect?
Why did most sold do as well as FTSE until 2017? What happened?
Most bought seem to have mainly suffered in 2014. What was the reason? Was it one particular spectacularly bad choice?
?
I've never paid much attention to these lists.
Maybe I should.
Lesson seems to be to watch where the crowd is going and then go somewhere else. If the crowd always underperforms, then any random somewhere else would be better.
Really interesting piece of research. Well done, and thank you.
Zoe is interning with us this summer. She's going into the second year reading PPE at Oxford University. She's done some incredible research this summer... this piece on Hargreaves Lansdowne is just an inkling of what she's been up to. There's a really heavyweight piece of research coming on a different topic... give us a few weeks and we'll reveal.
Seems a bit unfair to mention Hargreaves Lansdown specifically in the title and infer they are at fault by so doing. As you mention, other such brokers have pretty much the same list of shares.
I have yet to come across any convincing argument that crowd sourced share selections provides a quality list of shares in which to invest.
Of course, had you listened to Hargreaves Lansdown's 2019 portfolio picks then things would have been much better i.e.:
The thing is, even though we’ve focused on Hargreaves Lansdown, in a way this is a back-handed compliment. HL easily has the largest user base so there will be more traffic around their top lists compared to other brokers. And it's certainly the case that some lists - like the HL 2019 selections you mention - may pay off. But in this case, we've endeavoured to take a look at trends over a longer period of time and taking into consideration a larger selection of stocks which investors watch/buy.