The NAPS & SNAPS Portfolio Update - 25% annualised returns to date and 20 new selections

When do you find the time to focus on your investing? Do you get up at 7am to read the news and plan your trades? Do you scan the bulletin boards hourly for new ideas? Do you watch the market in real time like a hawk setting buy triggers, adjusting stop losses and analysing market depth?
I know this is what the cool gang do… but for me, this all sounds too exhausting. It’s summer, it’s too hot, and at times like these I’m glad to have an investment process that practically runs on auto-pilot.
If you read this piece I’m going to explain how I’ve been putting together a 20 stock, diversified portfolio that's been growing at 25% annualised with less than an hour’s work each January ( and some occasional work each July ).
Of course I’m not totally lazy. It’s just that there’s a thousand other things to do that are more fun than studying company accounts, more fun than worrying and more fun than endless, mindless trading.
Don’t get me wrong… I love stocks, but experience has taught me that I can love them far too much. All the trouble I’ve ever had in the stock market has come from over-attachment to stocks, over-confidence in their outcome and a complete unwillingness to let a favoured hand go.
So some years ago, after another extremely painful experience I had a zen buddhist a-ha moment. I realised that in order to more consistently win, I needed to completely let go of my attachment to stocks… I went systematic.
What is the NAPS Method?
If you already know your NAPS from your SNAPS then this section is not essential reading. But for those who are new to all this, I recommend studying the following material and links.
Alternatively if you prefer not to read, you can join me for an hour-long webinar where I’ll explain the full NAPS Portfolio Process in person on Friday 21st July at 1pm. If you sign up today you’ll be guaranteed a seat.
The NAPS Method essentially describes a systematic process for creating and maintaining a personal portfolio of shares.
This process is based on a few fundamental assumptions:
- We’re highly prone to a whole heap of behavioural flaws in the mind which tend to damage our investment returns. Using a rule-based, or checklist-driven approach counters this self-defeating behaviour most effectively. I call this Managing the Monkey and have made big conference presentations on the topic.
- Stock prices are individually highly erratic, but on average predictable using a little-known technique called ‘factor investing’. At Stockopedia the StockRanks simply define three of the most proven and powerful risk-factors - Quality, Value and Momentum - for every stock in the market. Selecting a portfolio of stocks that exhibit these risk factor traits (i.e. having higher StockRanks) should provide a good opportunity for outperformance in the long run.
- Of course buying high risk-factor stocks is, by definition, risky. And risk must be managed. It’s a cliche - but diversification is the only free lunch in investing. Each stock in a portfolio must be selected not only on its own merits but in relation to all the other stocks in a portfolio. There are lots of ways to diversify using classifications as I’ll explain.
- Over time, every stock’s StockRank will drift. This means that the stock may no longer be exposed to those all-important key drivers of return - Quality, Value and Momentum. Regularly rebalancing a portfolio is essential to ensure consistently high exposure.
That’s a bit wordy and theoretical… so if I’ve already sent you to sleep, let’s describe the original NAPS Process based on these ideas in a single sentence:
“Buy the top 2 ranked stocks in each of 10 sectors according to their StockRank, hold for a year, rinse and repeat.”
The NAPS Method is an archetype. It’s not prescriptive. It describes a way of thinking about investing that is more like a jazz chord progression that true artists riff around. Since starting these articles hundreds of investors have started using these rules and riffed on them to better fit their own needs.
Hopefully, some will comment below this article and share their own ideas, iterations, performance results and more.
Before I run through the year to date results and show the latest selections if you want to learn more you can catch up on some of the archive material in the following links.
- 2015 NAPS Portfolio / 2015 SNAPS Portfolio / Webinar
- 2016 NAPS Portfolio / 2016 SNAPS Portfolio
- 2017 NAPS Portfolio / 2013-2017 Studies
Performance Year to Date
I’ve been running the NAPS portfolios since the beginning of January 2015, rebalancing the portfolio every January, with a six-monthly rebalanced version for comparison (the SNAPS). In the first six months of the year, these portfolios are identical but differ in the second half.
It’s been a very strong first half of the year for both NAPS Portfolios with a 15.3% return from December 31st to June 30th. This compares to a 3.3% return for the FTSE All Share in the same timeframe, and an 11.0% return for all 90+ StockRank shares. So the NAPS process has beaten both the market and the overall StockRanks…. again.
Check out the charts for the full history since inception. The blue line is the annually rebalanced NAPS Portfolio, the green line the semi-annually rebalanced SNAPS Portfolio and the grey line (yes grey) is the FTSE All Share. I’m sure tracker fund investors are having a really wild time - so they get the colour grey.
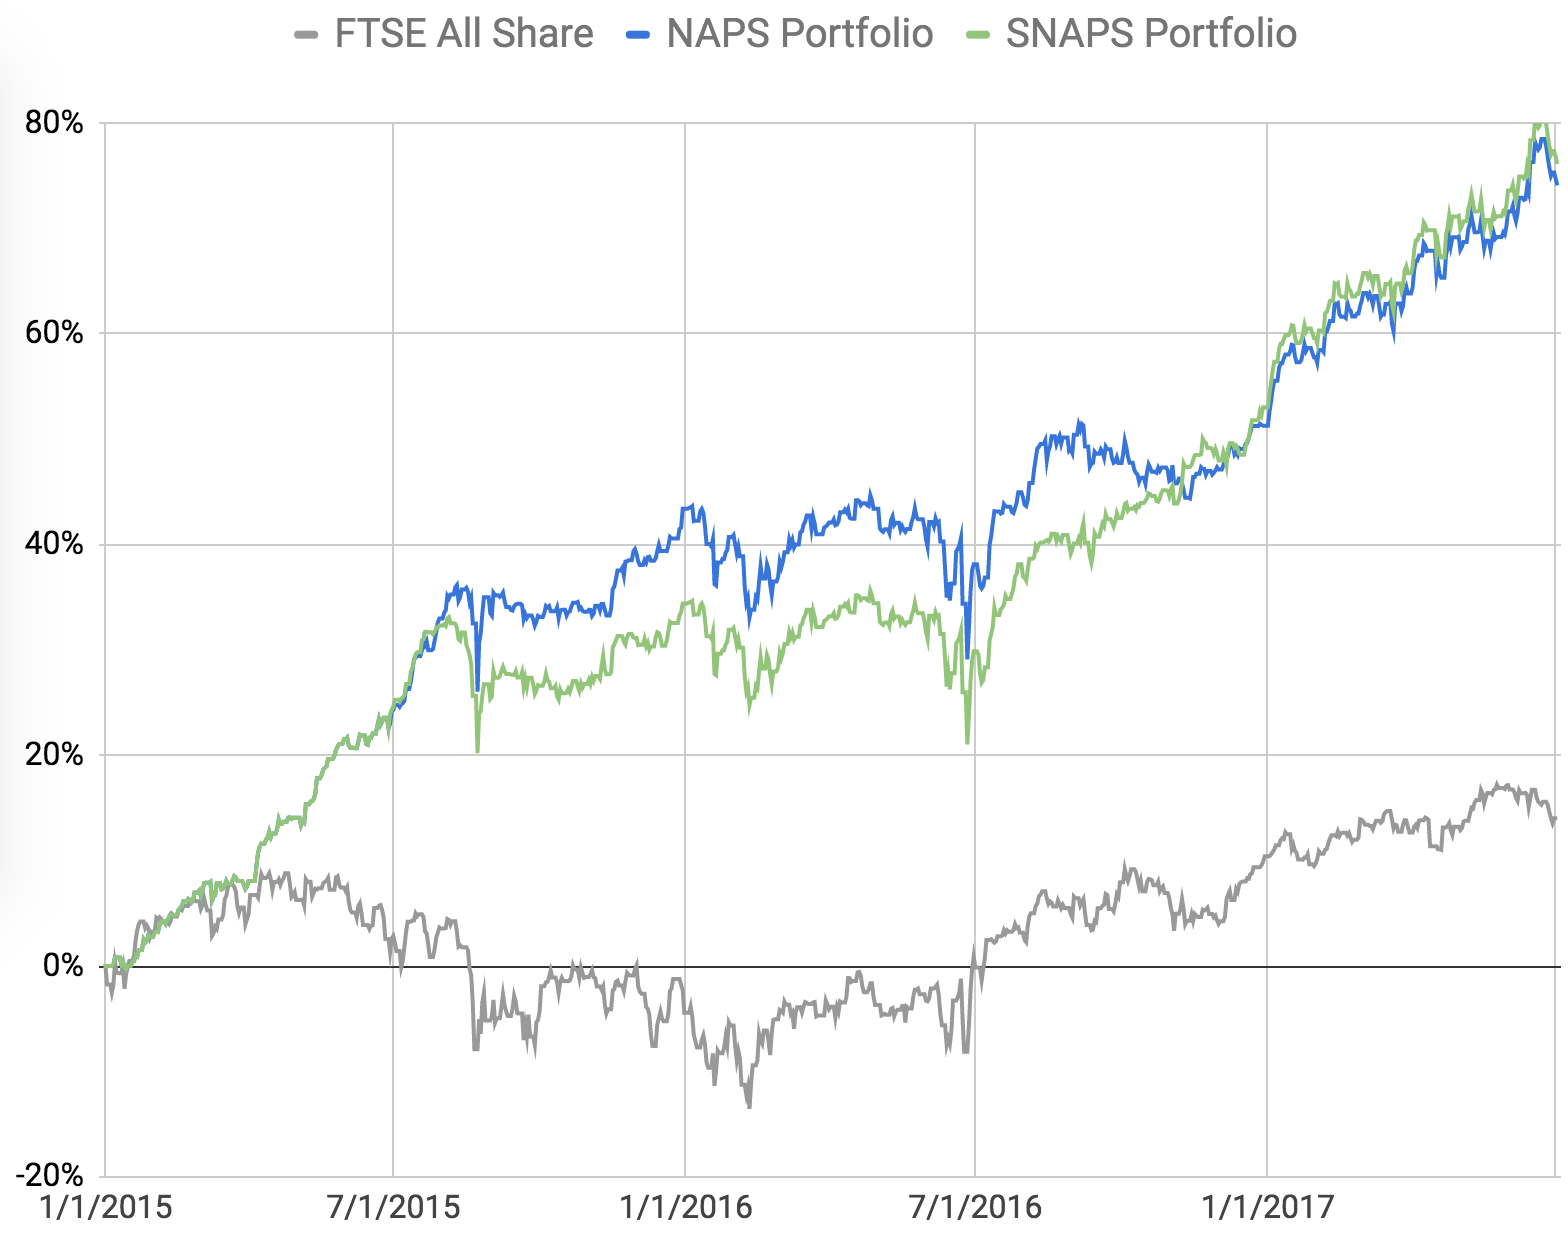
If you want to look at how this portfolio process would have done all the way back to 2013 then check out this blog from January that shows various backtested results across different portfolio rulesets. But I keep my study to the as-published portfolio since inception, rather than embellishing with backtests.
What’s even more extraordinary is that the NAPS Portfolio is not only generating far higher returns than passive index investing, it’s also doing it at a far lower risk. Admittedly we are only looking at a small sample, but the annualised volatility of the NAPS Portfolio has been about 8.9% to date, while the FTSE All Share’s has been 12.4%.
So much for the ‘stability’ of well-diversified indices.
In fact, investors in index trackers may be taking on far more risk than they realise. These packaged funds own far too much of the biggest stocks in the market and are often overweighted in certain sectors (like Mining & Banking) at the wrong times at the top of the cycle.
Personally, I don’t trust opaque packaged products and believe in self-reliance. We’re in a world where you can own the underlying shares directly, and structure a portfolio in a way that best suits you as a private investor. You can also react more swiftly to issues and take action on under performers in bad market environments.
NB - I think it's very important to re-iterate here that past-performance is not related to future returns. Almost on every single NAPS update I repeat myself on this. We've had a very good run for a few years and at some point markets are bound to make a serious reversal - some believe this is overdue. The NAPS Process won't protect anyone from equity market downside. Stocks, after all, are stocks - they go down as well as up.
Performance Attribution
A quick glance at the next chart shows the performance breakdown. Much like the performance of IG Design in the first NAPS Batch, one stock has stood out by a country mile - semiconductor & photonics group IQE up 120% in six months. It’s been followed by a couple of stocks typically ignored by bulletin board investors - Morgan Sindall and Games Workshop up 68% and 66% respectively. Not many were picking these shares at the start of the year.

On the other hand, Petrofac has been a shambles, while Quarto and Drax have seriously disappointed.
But what matters is averages. The first 6 months of the year have seen 60% of the stocks rising in price, with an average gain of 34%, and 40% losing in price, with an average loss of 13.3%. Put it all together and it’s been a strong performance. The use of stop-losses on the portfolio would have helped boost the performance further by limiting the Petrofac loss.
(NB - since I wrote this Quarto has taken a further nasty hit, but we’ll pick up on that at year end.)
Which are the best sectors to own?
If we break the performance down a bit further, we can see how stocks from each of the 10 different sectors have performed. It’s obvious that 3 sectors have performed poorly for the portfolio… Energy, Utilities, and Telecoms.
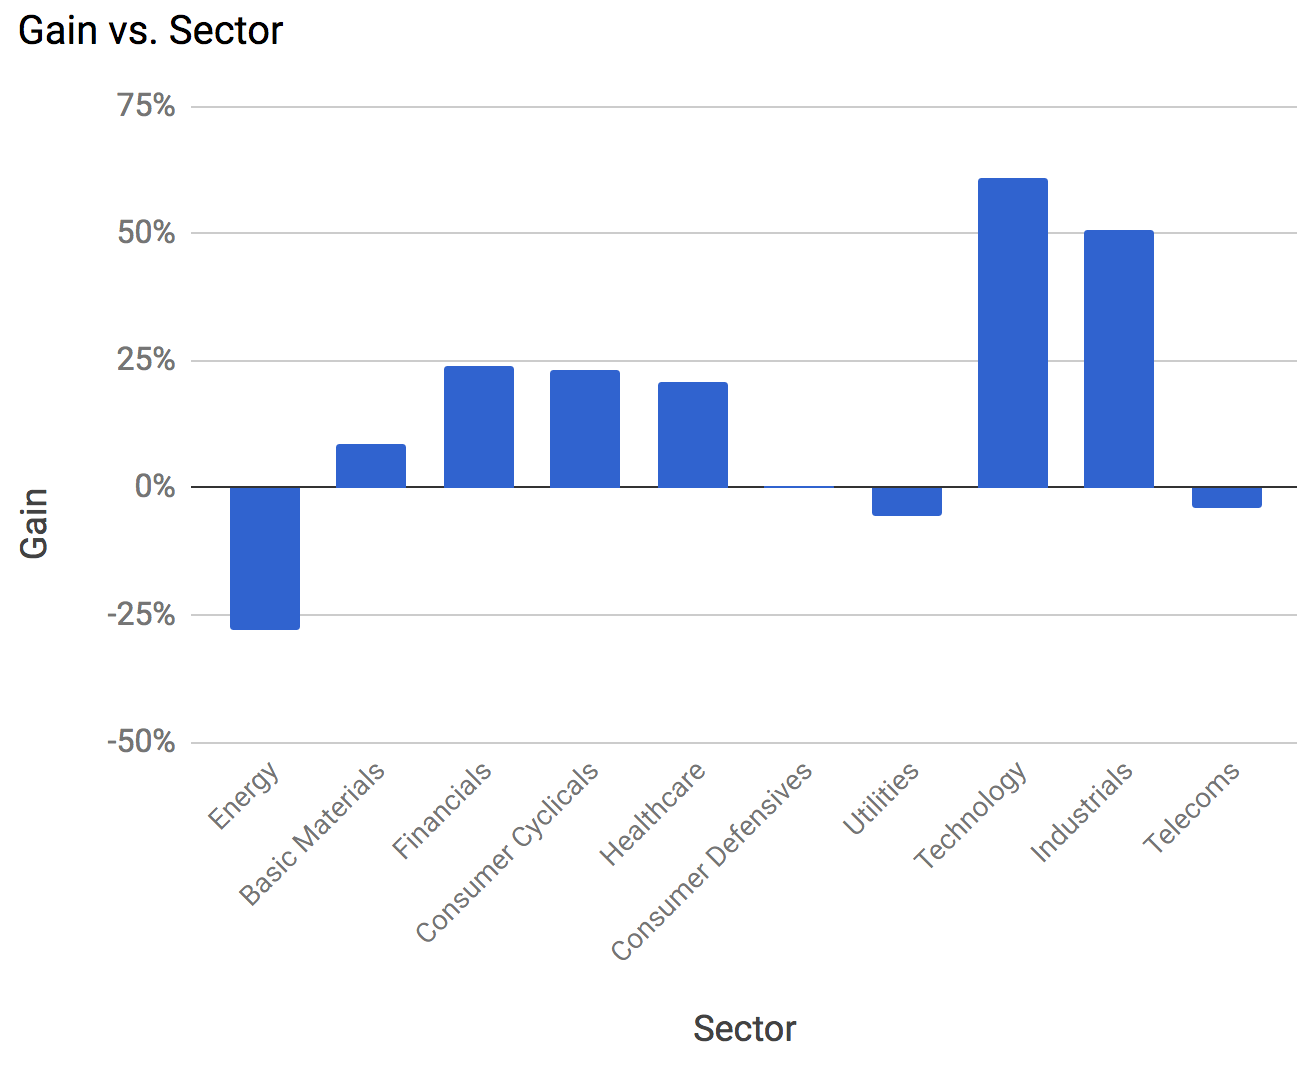
Now here’s the thing. Energy stocks are still pretty out of favour, while Utilities and Telcos have a pretty poor reputation as wealth generating sectors. In fact, some of the very best sectors to invest in are often those that have a higher proportion of stocks with ‘Economic Moats’ - characteristics which protect them from competitive pressures and enable them to maintain high profit margins.
I started the NAPS process a bit like Noah… shepherding stocks 2 by 2 from each of 10 sectors into the Portfolio. It was simple. It was easy to explain. But realistically it was never going to last.
While the StockRanks have performed admirably across all sectors , I’m convinced we’re leaving returns on the table using a rather inflexible approach. So in this rebalancing I’m going to be experimenting with the rules.
I’m no longer going to be enforcing the 2 stocks from each sector rule. I will be expanding it to allow a maximum of 3 stocks from each sector, and if a sector is thus excluded… so be it. We shall see that this has some interesting implications.
Why does rebalancing work ?
If we accept the principle that stock returns are partially driven by their exposure to risk factors (quality, value, momentum, low volatility), then it makes sense that we want to keep these exposures high. These ‘factor exposures’ are neatly bundled and represented on Stockopedia by the StockRanks. So let’s look at how the StockRanks have drifted in the last 6 months.
The following chart shows the StockRanks of all the portfolio positions on January 1st, versus their most recent ranks on the 1st July.
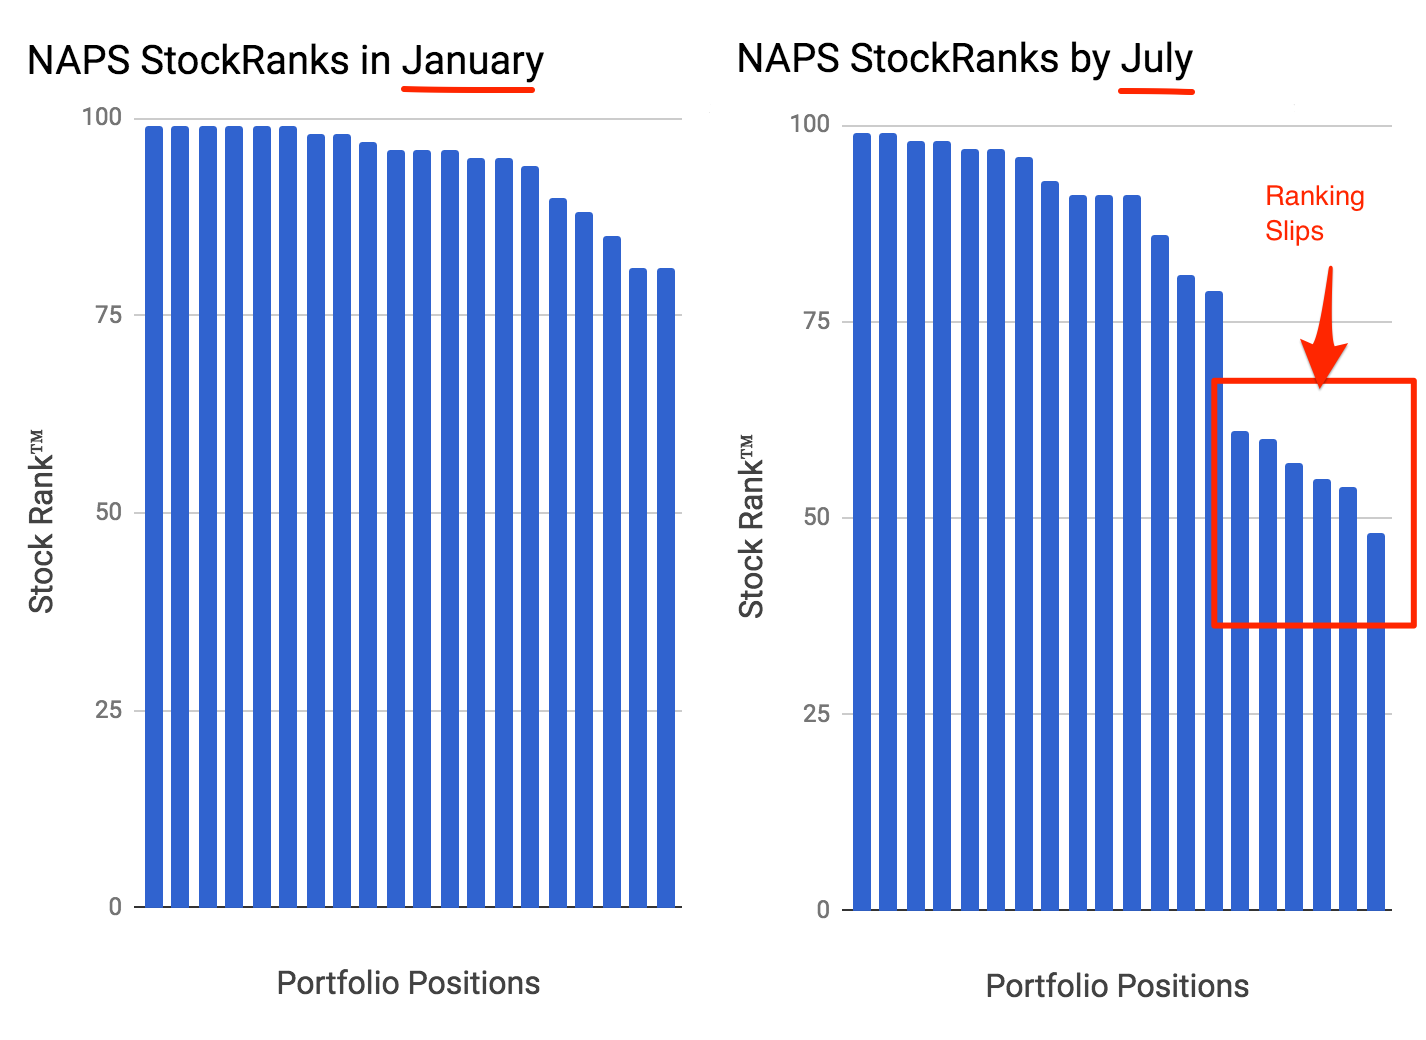
It’s extremely clear that over this time the StockRanks of most of the holdings have drifted downwards considerably - this can happen because valuations have risen, fundamentals have deteriorated or momentum has lapsed. The average StockRank in the portfolio has dropped from 94 to 81 during this time period. Many stocks have barely moved, but a whole set of them have fallen to the 45-65 StockRank range.
Now this creates a quandary and a trade-off. We could completely rebalance the portfolio, booting out the low ranking stocks & replacing with higher ranking stocks to preserve our exposure to the all-powerful QVM factors. But this comes at the expense of some quite substantial transaction costs. Is this trade-off worth it?
Well at this stage I don’t have a perfect answer. The six monthly rebalanced SNAPS have outperformed the annually rebalanced NAPS, but not by enough yet to make up for the increased transaction costs. So this is worth bearing in mind. We’re building a backtester and transaction cost model to answer these questions more clearly, but with a suggestions list as long as ours it may take some time to get there in full.
In the meantime, personal judgement is called for. It’s important not to churn away all your investment returns through over-trading or trigger tax liabilities unnecessarily. The new SNAPS portfolio has an average 1% bid-ask spread… it’s not excessive, but with broker commission and slippage costs it all adds up. So it’s important to be careful.
Nonetheless, the most important thing to realise is the application of rule 4: If you want to profit from factor-investing you can’t buy and hold - you have to rebalance. Whether it’s quarterly, semi-annually, annually, biannually is beside the point… if you don’t rebalance your portfolio the risk exposures will drift, the portfolio will end up looking average and flabby, and you could probably end up with average returns.
If you don’t like the idea of the costs of a full rebalance, it can pay here to take a pro-active approach to improving a mid-year portfolio. A bit like weeding in the garden. Some manual pruning of over-growing positions can be prudent, while pulling out the positions that are drying out and replacing them with new green shoots can make sense.
For the SNAPS - new ways to diversify the risks
Earlier this year we released a whole new set of stock classifications at the top of Stockopedia StockReports. The three new labels classify every stock across their Risk Rating, Size Group and Investing Style. These three labels come together to form an almost simplistic descriptive sentence for every stock in the market.

It’s easy to dismiss this as a gimmick when you see one of your favourite stocks labelled as a “Speculative, Small Cap, Momentum Trap”, but if you spend the time to learn about the theory behind these classifications I’m sure you’ll be convinced of their veracity.
In the extensive webinar I ran at their launch (which you can catch up on here if you missed it) I focused mostly on the performance histories of the individual classifications and how you can filter the market easily to find them.
But the real power of these new classifications is how they help diversify your portfolio… and over time the process has been changing.
- In 2015 I diversified the NAPS portfolio across sectors. Selecting 2 stocks from each of our 10 economic sectors. ( A sector is a broad classification of the business type of a company e.g. Financials, Energy or Utilities).
- 2015 made me concerned about over-exposure to microcaps. So in 2016 I diversified the NAPS across both sectors and size groups. ( Size groups are generally labelled according to the relative Market Capitalisation of the company - Large Cap, Mid Cap, Small Cap and Micro Cap).
But now, using the tools in the sidebar of the StockRanks Portal, you can optionally find shares quite easily across any of the five Risk Ratings (from Conservative to Highly Speculative) or any of the nine StockRank Styles.
So in this rebalancing I’ve decided to put some, but not all, of this to work…. I’m forcing the portfolio to include half low RiskRatings (Conservative / Balanced) and half moderate to high RiskRatings (Adventurous & Speculative). Highly Speculative shares are being completely excluded (as they tend to underperform over the long term).
The new SNAPS Process
Once this rule is combined with my new condition allowing 3 stocks from each sector, the portfolio magically excludes stocks from the 3 worst performing sectors of the first half. Now no Energy stocks, and no Telecom stocks are included, while only a single Utility is included.
Personally, I’m quite comfortable with this as the portfolio is still diversified across 3 super-sectors, 8 sectors, and 20 different industry groups. If the energy sector does outperform, we’ll be missing a trick, but it’s manageable.
So, in summary, my own selection rules for the SNAPS are as follows:
- Order by descending StockRank. (Of course, you could use other rankings - many use the QM or VM Rank preferentially).
- Select no more than 3 stocks from each sector.
- Select no more than 1 stock from each industry group.
- Select roughly a third large caps, a third mid caps and a third small caps. Exclude Micro caps completely.
- Select half amongst lower Risk Ratings & half higher Risk Ratings.
- Limit to 20 shares and ensure each stock’s bid-ask spread is less than 5%.
Really you need an algorithm to do this quickly, but it’s great fun building lists and collecting sets of stocks that approximately match the rules. Maybe if you are a dweeb like me and play card and board games you actually find set-collection quite fun!
The SNAPS Selections
The end result is a portfolio spread across risk, size, and style as follows. The defining characteristic of the portfolio is the prevalence of the “Super Stock” Style Classification ahead of all others. This is due to the use of the overall StockRank as our sort criterion. If we’d used the VM Rank we’d likely see more Turnarounds, and if we’d used the QM Rank we’d see more High Flyers.
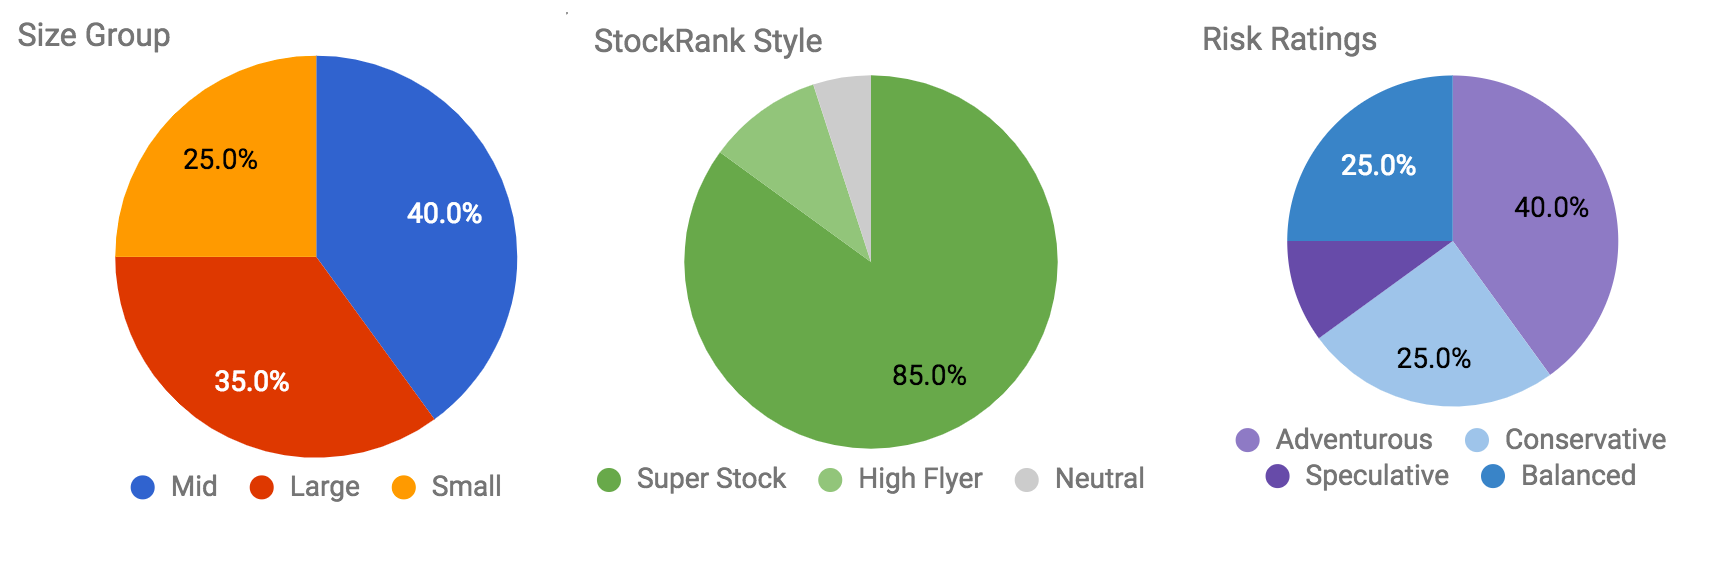
I’m the first to admit that the NAPS & SNAPS selections are usually pretty ugly. I can’t imagine anyone actually wanting to own this portfolio. I’ve always said the StockRanks are psychologically challenging as people find it hard to buy high ranked shares. Value stocks are normally quite ugly and have problems, Quality stocks are boring or lacking in ‘lottery ticket’ excitement, and Momentum stocks are just hard to buy because they’ve already gone up in price - put all three together and you tend to discover a set of stocks that may be unbearably hard for the typical investor to invest in. But that may be the whole reason they have outperformed.
It’s like a portfolio of ugly ducklings. Let us hope that it continues its unfolding into a Swan. But given the market jitters at the moment, there can be no guarantees. As we all know, past performance is not an indicator of future returns, and personally I continue to worry that the market may be a bit toppy.
Thanks to both Alex Naamani and Ben Hobson who have compiled the following write-ups on the 20 selections that have fallen out from the above adjusted rules.
Industrials
Morgan Sindall Construction & Engineering
Market Cap: £554.4m / StockRank: 99 / Adventurous Super Stock
Company Statement: “Trading for the financial year to date has been strong, with the positive momentum entering the year continuing throughout the period.” - Trading Statement, 4 May 2017
Shares in Morgan Sindall have soared by 66% in the six months since they entered the NAPS portfolio at the start of the year. The construction group appears to be trading well, and earnings forecasts have been rising steadily. It’s one of just six stocks to hold its position in the new folio.
Wizz Air - Passenger Transportation Services
Market Cap: £1.39bn / StockRank: 99 / Adventurous Super Stock
Company Statement: “We had a strong start to FY2018 due to the timing of Easter which leaves us optimistic for the year ahead.” - Final Results, 25 May 2017.
Wizz Air cut its earnings guidance just a month after joining the NAPS in January, and its shares slumped in response. But its full year results in May proved stronger than expected and the stock ended up being a big winner for the folio. It retains its position as the only Super Stock with an “Adventurous” RiskRating.
Harvey Nash Professional & Commercial Services
Market Cap: £63.2m / StockRank: 99 / Adventurous Super Stock
Company Statement: “The immediate outlook is positive, with the key measure of contractor work in progress being comfortably ahead of last year.” - AGM Statement, 29 June 2017
Recruitment group Harvey Nash takes the third Industrials position in the folio (next to Morgan Sindall and Wizz Air). It recently transferred from the Main Market to AIM in order to ease its admin and regulatory demands, and its shares have responded well. It’s a stock that Paul Scott likes.
Consumer Cyclicals
Games Workshop Leisure Products
Market Cap: £385.6m / StockRank: 97 / Balanced Super Stock
Company Statement: “We expect the Group's sales for the year to 28 May 2017 to be approximately £158 million and the Group's profit before tax to be above market expectations at not less than £38 million.” - Trading Update, 2 June 2017
Games Workshop keeps its place in the folio. After drifting for a few years, shares in this wargaming group have staged a spectacular recovery in 2017. A 68% gain for the NAPS in the first half was very welcome. But the strong momentum is starting to stretch the valuation here - Games Workshop’s ValueRank has fallen from 82 to 52 in 12 months.
Bloomsbury Publishing Media & Publishing
Market Cap: £125.6m / StockRank: 98 / Conservative Super Stock
Company Statement: “Whilst there is uncertainty as to whether Brexit will positively or negatively impact on Bloomsbury's EU sales, Brexit is not expected to have a major impact on Bloomsbury.”
Bloomsbury takes the third Consumer Cyclicals place in the folio (next to Persimmon and Games Workshop). Sales at Bloomsbury exploded in the decade after it signed up J.K. Rowling in 1996, but things have been quieter of late. It reported better than expected figures in its recent results and said it was hoping for more of the same this year.
Persimmon Construction & Housebuilding
Market Cap: £6.92bn / StockRank: 99 / Adventurous Super Stock
Company Statement: “Persimmon’s operational performance continues to be excellent, with the Group delivering higher volumes of newly built homes in local communities across all our regional markets, supported by the resilience of the UK economy.” - Trading Statement, 27 April 2017
Quarto is OUT - replaced by Persimmon. The UK’s big housebuilders have been on a terrific run since last summer, but 2015 was the last time any of them made it into the folio (and that was Berkeley Group). Their propensity to tumble at the first sign of economic trouble means they often look cheap. Yet low interest rates and supportive government homebuying schemes have proved extremely helpful.
Financials
Miton Investment Banking & Investment Services
Market Cap: £62.8m / StockRank: 98 /Adventurous Super Stock
Company Statement: “The acceleration of our growth over recent quarters underlines our confidence in our prospects.” - Final Results, 16 March 2017
3i is OUT - replaced by Miton. There has been strong momentum in Gervais William’s fund management group Miton, over the past year. Not only has the share price nearly doubled to just short of 40p, but the latest results suggest that Miton is building a strong presence in its markets.
Morses Club Banking Services
Market Cap: £161.2m / StockRank: 96 / Speculative Super Stock
Company Statement: "We remain confident in our outlook." - Preliminary Results, 27 April 2017
Record is OUT - replaced by Morses Club. Morses Club operates in the “home collected credit” market, where it’s growing at a clip and planning to buy up other “non-standard finance” providers. It floated on AIM in May 2016 and is now starting to hit the StockRank radars.
LSL Property Services Real Estate Operations
Market Cap: £226.0m / StockRank: 95 / Adventurous Super Stock
Company Statement: “Underpinned by a series of strategic initiatives, the business is well placed to deliver a solid performance in 2017. We are positive regarding the outlook for the business.” - Preliminary Announcement, 7 March 2017
LSL takes a third place among the Financials in the folio. From a diversification perspective, this is a business very much dependent on the health or the residential property market. It operates that largest network of estate agents in the country and has interests in asset management and financial services.
Basic Materials
Centamin Metals & Mining
Market Cap: £1.78bn / StockRank: 98 / Speculative Super Stock
Mondi is OUT - replaced by Centamin. Egypt-based gold mining group Centamin saw production fall at its flagship Sukari mine in the first quarter. But that’s expected to recover this year and guidance for 540,000 ounces of gold remains intact. A lot can go wrong with mining companies, but Centamin regularly has one of the strongest StockRank profiles in the sector.
IG Design Containers & Packaging
Market Cap: £218.3m / StockRank: 96 / Adventurous Super Stock
Company Statement: “I am delighted to report a year of very strong overall progress with record sales revenues, increased gross margins and excellent operating cash flow... This has resulted in excellent profit and earnings per share growth, fuelling increased shareholder returns and enabling us to initiate further fast payback investment to sustain incremental future progress.” - Preliminary Results, 27 June 2017
Central Asia Metals is OUT - replaced by IG Design the huge winner from year 1 in the NAPS. Exchanging a small mining company for a gift packaging and stationery business feels like cheating - but Basic Materials is a broad sector. IG Design has been growing very fast in recent years, and its price momentum reflects that. International growth in Europe and the US has been particularly impressive.
Synthomer Chemicals
Market Cap: £1.66bn / StockRank: 89 / Balanced High Flyer
Company Statement: “Overall, the Group continues to trade in line with the Board's expectations, and accordingly the view for Full Year 2017 remains unchanged.” - Trading Update, 27 April 2017
Synthomer is a new entrant to the folio, and takes the third Basic Materials place. It makes chemicals that are used in a wide range of settings - from paper and carpet to paint and latex gloves. Its price leapt in January on a better-than-expected trading update, which partly explains why it’s one of just two High Flyers in the folio. With a ValueRank of 42, Synthomer is a little pricey when pitched against the StockRanks, but its quality and momentum are strong.
Consumer Defensives
McColl’s Retail Food & Drug Retailing
Market Cap: £230.3m / StockRank: 96 / Adventurous Super Stock
Company Statement: “2017 promises to be an exciting year for McColl’s. We remain very confident about achieving further progress against our strategy.” - Preliminary audited results, February 2017
McColl’s keeps its place in the folio. Its 2016 figures were a little unspectacular but McColl’s is still on a mission to create the country’s largest convenience store chain. Its shares, like its earnings forecasts, have been on a slow but steady upward trend over the past year. Paul Scott has concerns about it.
McBride Personal & Household Products & Services
Market Cap: £341.2m / StockRank: 92 / Balanced Super Stock
Company Statement: “While trading conditions in the second half are expected to remain challenging, we believe our ongoing margin and cost initiatives position us well to mitigate these effects. As such, the Board's full year expectations remain unchanged.” - Half-Year Results, 22 February 2017
McBride is a new entrant to the folio, and takes the third Consumer Defensives place. The company makes private label household and personal care products (like Surcare washing liquid). Its shares have been on a strong run over the past two years and the company appears to be on track to maintain its profitable growth. Paul Scott has some reservations about it.
Finsbury Food Food & Tobacco
Market Cap: £151.2m / StockRank: 91 / Balanced Super Stock
Company Statement: “Furthermore, the Group's track record of exceptional growth and diversification over the prior years illustrates that it has the right strategy in place to continue to deliver growth and improved shareholder value over the coming years.”
Finsbury Food retains its place in the folio. It’s been a mixed year in terms of share price performance from Finsbury Food. Profitability shows signs of growing modestly and the company sounds upbeat, as you’d expect. But there are nagging concerns about the impact of exchange rates and the national living wage, and how the company will deal with them.
Technology
Vitec Computers, Phones & Household Electronics
Market Cap: £456.8m / StockRank: 95 / Conservative Super Stock
Company Statement: “Overall, the Board now expects Vitec's full year results to be slightly ahead of current market consensus.” - Trading Update, 10 May 2017
CML Microsystems is OUT - replaced by Vitec. Shares in specialist imaging technology company Vitec, have doubled to 1,000p over the past year. Quality and momentum are the main influencing factors in its high StockRank. Earnings are forecast to grow strongly this year, helped by the impact of exchange rates.
Computacenter Software & IT Services
Market Cap: £995.0m / StockRank: 93 / Balanced Super Stock
Company Statement: “While much remains to be done to complete the year, we believe that the Group's performance for 2017 as a whole will exceed current market expectations.” - Trading Update, 24 April 2017
Computacenter holds its position in the folio - making it one of the longest held positions (it was first added in 2015). Performance-wise, 2016 was a bit of a mixed year for Computacenter but there is an expectation that 2017 will be a year of progress. Indeed, it recently upped its earnings guidance on improved trading conditions.
Utilities
SSE Electric Utilities & IPPs
Market Cap: £14.60bn / StockRank: 85 / Conservative Super Stock
Drax and Fulcrum Utility Services are OUT - replaced by SSE, which is the only utility making it into the SNAPS folio. Shares in the company have traded in a relatively narrow range over the past four years, and there have been no major shocks - which is precisely what investors in high yielding utility stocks are after.
Healthcare
GlaxoSmithKline Pharmaceuticals
Market Cap: £80.43bn / StockRank: 84 / Conservative Style Neutral
Company Statement: “Around 40 new potential medicines and vaccines were profiled, supporting the Group's outlook for growth in the period 2016-2020 and the significant opportunity the Group has to create value beyond 2020.” - Quarterly Results, 26 April 2017
Indivior is OUT - replaced by GlaxoSmithKline. Shares in Glaxo soared on the EU referendum result in 2016 but went on the lose most of those gains by the end of the year. 2017 has see a resurgent upward trend in price which has stretched the valuation. Glaxo makes it into the folio as a Conservative “Style Neutral” position - it looks a little expensive and its previously strong momentum is wavering.
UDG Healthcare Healthcare Providers & Services
Market Cap: £2.15bn / StockRank: 83 / Conservative High Flyer
Company Statement: “The Group is increasing its guidance for constant currency diluted earnings per share (EPS) for the year to 30 September 2017 by 2% to a range of between 15% and 18% ahead of last year.” - Half Year Report, 23 May 2017
Caretech Holdings is OUT - replaced by UDG Healthcare. In the absence of many options, we’ve gone for a stellar High Flyer in the form of UDG. After a strong run over the past year the stock looks expensive, but the strong quality and momentum could carry the shares further.
Disclaimer
This is not financial advice. Our content is intended to be used and must be used for information and education purposes only. Please read our disclaimer and terms and conditions to understand our obligations.

38 comments
I have a potential further enhancement of a portfolio such as NAPS but is potentially more widely applicable across what are put across as 'themed" investments such as along 'Guru' lines. I don't know the statistics of my suggestion and would invite comment.
My main concern is overtrading and trading costs, but also that at times, stocks will move out of its narrow definition of selection (such as a QVM score) only to mean revert back again. You allude to this above and the need to 're-balance' the portfolio at the end of the year to replace stocks that have fallen out of your strict criteria for selection, but with the acknowledgement that you 'don't have an answer' to the problems this poses.
Looking at the the performance stats of the various Stockranks shows that several combinations of Quality, Value and Momentum exhibit outperformance be it by vigintile, decile or quintile. So that could be QVM, VM, QM and even to an extent QV. Does one really have to adhere to holding by just QVM for one's selection? One could alternatively choose to use ANY of the Q,V,M combinations and statistically, one may assume a similar chance of outperformance for the relevant score.
So, for instance, if my stock had fallen below a QVM of 75 say, I wouldn't necessarily chuck it out mechanistically but look also at the other score combos and if the stock fulfilled any score above 75 say, use that as an excuse to retain.
Basically, I'm saying that constructing a single portfolio based on a single theme (be it 'Guru' or score based) actually potentially adds its own layer of risk of underperformance and therefore diversifying not just by stock size, sector etc. one can also choose to diversify across themes which could also help reduce trading costs, reduce risk and volatiity if you apply the criterion that any stock can stay in if it meets any one relevant score.
Is there anything I've missed?
Hi
Thanks very much putting all the list of the stock you thing right for SNAP for jully 2017
Thanks for taking the time to do this. But I concur, the missing link for me is how to correctly determine, early doors, whether the market is risk on or risk off.
Shrivganesh,
On the issue of where to place stops you might also like to look at this article.
http://www.stockdisciplines.com/best-stop-loss
Interestingly they seem to have identified a couple of important levels. By increasing the stop loss from 8% to 9% from a recent high (not the buying level) they found that the number of times you were stopped out prior to a rebound was reduced by 50%, with another big reduction between 14% and 15%. So those levels of 9% and 15% from a recent high may be good places for stops. Of course, that may not apply to the UK market.
On the matter of whether to buy back into a share you are stopped out of, personally, I adopt a very bad approach.
It is very irritating to sell a share only to see it turn round and go much higher straight away, so I avoid the problem by burying my head in the sand. If a stop is hit, I sell up and remove the share from my watch lists and monitors and try to avoid looking at it for the next few months. That way I don't know or care what its price does. Probably a very bad and perhaps immature thing to do, but from a psychological point of view I find it useful.
I think in one of Robbie Burns books he writes that he uses a "three strikes and out" approach. If he fails to make money on a share three times he will not touch it again. The idea behind that is to try to avoid "revenge trading" where an investor is determined to make money on a particular share to make up for past losses.
I posted following article quite recently in response to Stockopedia article in April specifically on the subject of Stop Losses. It demonstrates the frustration that I feel about this subject!
"Since investing in SmallCap stocks on a regular basis in 2014 I have tried to use manual stop loss set at c. 20-25% given the inherent volatility of small cap stocks. This has been frustratingly unsuccessful given that many stocks haven fallen precipitously before I could hit the sell button. Over a period of 2-3 years 11 stocks (admittedly a small sample) sold on hitting the stop loss which sometimes massively exceeded the target 25% due to dramatic falls during a single trading session (Revolution Bars (LON:RBG), Plus500 (LON:PLUS) to name but two) resulted in significant lost 'profit' due to 8 out of the 11 stocks 'bouncing' back to levels significantly higher than the sold price (which was often closer to 35-50% down from cost or the 52 week high, whichever was higher, rather than the 20-25% I would have liked to operate). Admittedly if an automated stop loss of 20% had been in place and it was possible to execute a sale at that price (not always the case with a dramatic fall) then the notional loss would have been reduced by c. 65% which I guess is a lot better but still not a great advert for a strict stop loss policy!"
An addition to this comment relates to Tracsis (LON:TRCS) which fell by c. 30% following a trading update earlier in the year. This should have prompted a sale but I allowed emotion to take over and really couldn't see that the update merited the share price fall so I held on. On this occasion I seem to be right as the share price has recovered from 30% + down to 'only' 20% down. Had I sold this I would have missed out on some recovery. Another illustration of the frustrations associated with a rigid stop loss policy - or perhaps I am just unlucky!!
"I'm hoping to build an equal-risk portfolio weighting algorithm, rather than just equal-weight."
That would be terrific Ed, I look forward to it.
If you fancy experimenting with equal-risk weightings, you can estimate a risk-parity weighting fairly crudely from the data that Stockopedia currently provides.
Basically you want to weight based on 1/(1y Volatility %). So for the new SNAPS 2017 portfolio you would get weights like this (where weight=0.05 is the equal weight point):
Does it work? Well, I tried it out on the NAPS 2017 stocks using my own calculation of volatility since Stockopedia did not publish volatilities back in January and the difference between equal-weight and the pseudo-risk-parity looks like this (equal weight in green and risk parity in blue):
The effect is quite small. Admittedly this ignores covariance between the stocks, but I doubt the result would be hugely different. I suspect that risk-parity weighting is more effective when you use asset classes with significantly different volatilities (such as stocks and bonds.)
For the record these are the volatilities that I used for the NAPS2017 plot:
Great to see a worked example. Nice work. However, I don't think you can draw any conclusions from one sample like this. I believe it would have to repeated hundreds or thousands of times to come to any meaningful conclusion.
Conceptually, I think it makes sense to vary position size by some measure of volatility. Volatility as a proportion of price (for example, 20 day average vol / last close) can vary 3 fold easily between stocks so your position size would vary by 3 times too (compare IQE to SSE, for example). A 20% fall in one of these if their position size had been derived by equal weighting would be comparatively more unpleasant than if the position had been derived from volatility measurements.
But, you have to be very careful with low volatility stocks suddenly increasing in volatility. I don't have a good example of a UK stock to hand right now, but if you access to European stocks, look at CNWK which is very volatile now compared to last year. Also, a lot of smaller stocks, don't move for long periods and suddenly jump eg ALMER. This can play havoc with your volatility assessments. From memory stockopedia have their own proprietary tools which look at volatilty over years rather than just the last 20 days or so.
It is said that the only free lunch in investing is diversification. Another is volatility-weighting your position size. The new stockopedia risk ratings should prove very useful way to diversify your volatility within the portfolio, when used like Ed proposes!
You are quite right that you cannot conclude anything from a single worked example. There's quite a large body of work theoretically and empirically about the use of volatility in weighting portfolios for those interested in searching out more evidence for and against.
You definitely need to compute volatility over reasonably long periods, certainly at least a year, to apply these techniques to NAPS-like portfolios. Stocks which "don't move for long periods and suddenly jump" are quintessentially highly volatile.
There is definitely interest in new rule-based ways to construct portfolios these days. MPT seemed to settle the argument by "proving" that in an efficient market you could not out-perform the market-cap-weighted portfolio over the long term, which gave rise to passive tracker funds, as well as debates about how to find anomalies/inefficiencies in the market which allowed you to beat the market portfolio.
But more recently a very arcane branch of financial maths called "stochastic portfolio theory" has shown how to construct portfolios which (in theory) out-perform the market-cap-weighted portfolio, including the equal-weight portfolio and the risk-parity portfolio. A curious feature of these new methods is that they do not rely on trying to estimate the future mean returns of the stocks, but only their volatility and covariance (which tends to be more stable over time.)
As a retail investor with no background in finance, computing or statistics and a very busy day job, I tend to take a lot of what I read as said. So having read a fair number of investment books, I have tended to take as gospel the value of position sizing your share allocations according to volatility.
So while swimming in the Ionian sea, bizarrely, my mind turned your recent comment “…You are quite right that you cannot conclude anything from a single worked example. There's quite a large body of work theoretically and empirically about the use of volatility in weighting portfolios for those interested in searching out more evidence for and against…” and I thought why don’t I look at it myself.
So, admittedly after a fairly boozy lunch, I forewent the siesta and wrote a small script to test portfolio position sizing. And I have to say I was shocked. Because, after randomly constructing 1000 portfolios both equally weighted and volatility weighted, I found the mean returns were much better in the equally weighted portfolios.
But then I remembered Stockopedias pdf on Risk Rating where Ed showed that his low portfolio stocks did better from 2013, but from 2016, the highly speculative and speculative shares outperformed the conservative, balanced group of shares.
So I went back and looked at my data in 2016, 2015 and 2014 and the results very much tallied with Stockopedia’s!
Broadly, what I did was select UK shares with 4 years of data. I constructed random portfolios of 40 stocks with total exposure £1 million. So £25000 each in the equally weighted portfolios but varying positions in the volatility weighted. Volatility was assessed by looking at exponential moving average (EMA) standard deviation of previous years closes divided (normalised) by EMA (256 days) closing prices. I started with 1000 random portfolios but, being on holiday and risking the wrath of my wife, I decided to reduce this to 200 to speed things up (the computer was working overtime too).
These are the results:
It’s difficult to tell what’s going on from the line charts, but one gets an ideas of the spread of the returns in the 200 random portfolios. This confirms that just looking at the returns on one portfolio is meaningless. By grouping the returns into 20 buckets, one gets an idea of how postion-weighting influences returns.
We see much better grouping (less dispersion) in the volatility weighted group, but we are missing out on the long tails (positive skew) in 2016. It looks like volatility weighting worked in 2014 but was counterproductive in 2016.
What do the statistics show us? These are the mean, median etc 1 year returns of portfolio starting the year with £1 million exposure.
I think this shows that:
Now we just have to answer the question – how the hell do we safely determine the market environment?
Perhaps I will have to wait for next year’s holiday…
If you're always short volatility over an investor's lifetime, you get exposed to all the episodes where it helps. The nice thing is it doesn't hurt that much when it doesn't help, so you should come out on top in the end, even without market timing.
Also it helps with attitude: if you prepare for downturns by limiting your volatility exposure, you're likely to be in a good state of mind to weather the storm instead of selling everything at the bottom and buying back when it's toppy again (which is the real killer for high vol investors).
The other thing about 'being short volatility' is that "most investors are interested in wealth compounding" and this is better captured by geometric means (compound annual returns) ... an asset's geometric return is always lower than its arithmetic return and the difference is larger for high-volatility assets." Ilmanen (Expected Returns). Over the long term, lowering the volatility of the portfolio is a way to improve overall return.
The study I presented showed that the range, spread, dispersion of returns is much narrower when position size for high volatility stocks is reduced.
Obviously volatility can also be reduced by picking lower volatility stocks in the first place!
I think you are leaving some returns on the table, but I'm not sure that the tweaks you are doing will make a big difference. At the moment you are getting a return which is basically similar to "sampling" all stocks with a Stock Rank > 90 or thereabouts. ("sampling" means effectively picking 20 out of the available matches at random.)
You can get a noticeable improvement by also filtering for Altman Z Score (2) > 4. (Also works for NAPS2016). Why? I'm not completely sure tbh but I think it might be because you are using an arithmetic "blend" to combine Quality and Value and it tends to choose some stocks which are high Value but not for a good reason. It's possible a rethink of how you blend Quality and Value would be worthwhile, or there may be other filters which help to exclude poor prospects too. (In other words the Altman filter is not a solution so much as a pointer to what might be going on.)
_________________________________________________________________________________
For the SNAPS 2017 you have chosen to include the Risk Ratings and likened it to the diversification you introduced based on sector and size. But I think this is a bit of a stretch of the meaning of the term "diversification".
Diversification is used to reduce "risk" (i.e. volatility) of a portfolio by choosing stocks with low covariance, so that when they combine in a portfolio the overall volatility reduces.
Sectors are a factor where this is definitely true, and Size is a factor where it is reasonably true. However the Risk Rating (Volatility) is a factor where it is clearly not true. Spreading your risk across high and low volatility stocks is not a technique to reduce volatility.
Volatility might be better judged in terms of the return of the stock and I think you would have more success with filters which limit the maximum volatility you will accept based on the previous year's return, e.g.: % Price Chg 1y > 2.5 * 1 yr Volatility % (choose your own multiplier to taste!)
_________________________________________________________________________________
Talking of free lunches, I think regularly rebalancing an equal-weight portfolio is probably in the free lunch category, since it forces you to buy low and sell high almost painlessly! (In fact there is a branch of financial maths now which shows that equal weight portfolios do out-perform market-weight portfolios provided that a market meets certain conditions.)
Equal weighting is no panacea: first, it gives you a major small cap bias (compared to cap-weighted benchmarks) which is likely to drown the volatility-harvesting effect. And then, that effect itself only works if it's done at a frequency which does not clash with momentum (rebalancing is a mean-reversal strategy, the opposite of momentum).
Maybe it's not a free lunch - more like a free hors d'oeuvres!
But for most of us, what I like about the equal-weighted portfolio is that it dissuades you from allowing a stock to grow to dominate your portfolio as you start to fall in love with it and then find it difficult to decide when to sell. If you rebalance regularly (maybe only every six or twelve months) you automatically take some profits without exiting from good positions. I think it is a good discipline for the small investor and very easy to implement.
There is some theory behind the claim that equal-weighting beats market-weighting, but as ever the maths only apply over "long enough" time periods.
Yes, it helps for risk management, though it may be a little bit overkill for that. You can get almost all the risk management benefits at a fraction of the hassle and cost with a weight cap rather than rebalancing to equal weight. My own rule is approximately to enter positions with the mean weight of the portfolio and trim anything that gets above 2x the mean weight back to mean. That keeps exposures in check with a satisfyingly low turnover.
I disagree with this. From memory, without this constraint the portfolio would have been composed of 14 Adventurous/Speculative shares and 6 Balanced/Conservative. I wanted a higher weight to lower-volatility shares, so i forced an equal split 10:10.
As we've seen in our research into the RiskRatings, lower volatility shares tend to see lower drawdowns (on average). So this constraint should help lower the downside volatility.
Of course, we really should be analysing the the impact of these constraints on the overall portfolio volatility - which relies on correlation analysis. I haven't done this as of yet for the NAPS. We'll be bringing in correlation analysis to the portfolio tools in future. I'm hoping to build an equal-risk portfolio weighting algorithm, rather than just equal-weight.
Hi Ed
This is Very Nice Presentation
I am one of those who over trades and overactive watching all the
news,bb, and read all the news papers every morning and company results
as they are released at 7 am.
After losing 60 % in Tesco shares by holding from 30 Jan 2013 to 4Jan2016
thinking that over trading is bad, good company, sit tight!!
Now i want to put a stop loss but i am not able to decide at what percentage you
cut the loss!!
As you say in this article that you could have cut loss then the Snaps would
have been much more impressive
At what percentage you would have put a Stop Loss ?
Can Stockopedia system help to put Trailing Stop Loss Parameter which would
be more beneficial for your subscribers as we are approaching down slope soon
Thanking You and your team.
SHRIVGANESH,
Where to place a stop loss?
You might find this paper useful.
http://lup.lub.lu.se/luur/download?func=downloadFile&recordOId=1474565&fileOId=2435595
In that study (of Swedish stocks) the researchers found that a stop loss level of 15%-20% led to the best returns.
The optimal level does seem to vary by market and by investing strategy.
Hi Blissgull
Thanks for your reply
This paper consists of 65 pages
I will go through it
Your summary gives good idea .
My Next Question once you cut loss @25%
If that stock starts to move back what you do
Do You Buy back when it goes up 10% or 15%.
I am sorry i am asking another question
'Cas HSBC puchased at 640p in Apr 2015 and sold
504p in Jan 2016,Now It is around 730p + !!!
It is very very difficult to get back in!!! Difficult Game !!!
Ed,
Is another one of your criteria to exclude foreign based companies as Globaltrans Investment (LON:GLTR), Plus500 (LON:PLUS) & MHP SA (LON:MHPC) all appear in the top ten stock ranks using the SNAPS screen?
I struggle with spread and the repositioning.
Some of the best returns seem to come from small caps with large spreads (liquidity premium) but these can't then be overtraded.
But I understand that rebalancing position size ( ie top slicing winners and adding more to underperformers) increases portfolio returns (?by a bit more than 1% per year).
I think Ed takes the view that it's the average spread that matters so just take the trading cost downside to the few stocks in your portfolio with high spread.
Alternatively I suppose one could have a different rebalancing approach to expensive stocks.
Ed - Serious question - Is this all you do now investment wise for your own live portfolio - Personal question so feel free to reply appropriately.
I am one of the ones who does check news each morning although it does only take about 20 minutes so not too bad - I do it for 2 reasons - To keep track of the shares I own and to spot ones I might want to.
I do believe that owning 20+ or even 40+ shares is not big ask for investors on the basis you can easily keep track by reading the news each morning.
Anyway, as I say do feel free to reply appropriately to a personal question as I am sure some, including me, maybe coming round to the few hours a year than few hours a week approach.
Hi Ed,
An excellent article, as usual.
I think your modified selection rules for the SNAPS portfolio make a lot of sense, except for the following one:
"So in this rebalancing I’ve decided to put some, but not all, of this to work…. I’m forcing the portfolio to include half low RiskRatings (Conservative / Balanced) and half moderate to high RiskRatings (Adventurous & Speculative). Highly Speculative shares are being completely excluded (as they tend to underperform over the long term)."
This is because, according to your article on the Risk Ratings:
http://help.stockopedia.com/product-guide/stockranks/advanced/the-riskratings
speculative stocks tend to do badly in the long run. Although your article suggests that speculative stocks can do well over the short-term during 'risk-on' market periods, it implies that they are likely to do badly during 'risk-off' periods. As we have no way of predicting reliably whether the coming 6 months will be a 'risk-on' or a 'risk-off' period, I think it would be both simpler and better to just exclude Highly Speculative stocks and otherwise ignore the Risk Ratings when constructing the SNAPS portfolio using your other selection criteria.
Another point I would like to make is that although modifying and adapting the selection criteria for the NAPS and SNAPS portfolios is sensible, this does make it much more difficult to evaluate their past performances because we are not comparing like-with-like when we compare their performance records over different years. And if we just look at the most recent year's performances of the portfolios, that is too small a sample size to draw statistically valid conclusions.
Indeed, but only on average. From the Classifications Launch Webinar I analysed all the 'winning style' / 'risk rating' crossovers. You can see from the below that on average speculative and conservative "super stocks" have done very well. So I'm quite comfortable with the balance.
True, but I'm less interested in data-mining and over-fitting a strategy to past data, I'm more interested in developing & applying a sound philosophical framework and set of principles.
If you want to see more rigid rules in action - review this blog from January. Fiddling with the NAPS rules in January 2016 actually harmed the performance through the year, but it's still been a satisfactory outcome. I was happier with the risk balance in 2016, even if the performance was lower.
Hi Ed,
In reply to my comment that "speculative stocks tend to do badly in the long run", you wrote:
"Indeed, but only on average. From the Classifications Launch Webinar I analysed all the 'winning style' / 'risk rating' crossovers. You can see from the below that on average speculative and conservative "super stocks" have done very well. So I'm quite comfortable with the balance."
OK, that's a good point, which I accept.
Nevertheless, the following two selection criteria:
"(1) I’m forcing the portfolio to include half low RiskRatings (Conservative / Balanced) and half moderate to high RiskRatings (Adventurous & Speculative). (2) Highly Speculative shares are being completely excluded (as they tend to underperform over the long term)."
mean you are forcing your portfolio to include some shares with lower StockRanks than the portfolio would otherwise contain if you ignored Criterion 1 and just imposed Criterion 2. So I suspect that imposing Criterion 1 might not provide any real benefits to the performance and riskiness of the portfolio.
But some of them are sooooo ugly Ed. :-) I'm going to have to grit my teeth and look at them all though
Regarding rebalancing
i) could mean varying position size as well as implementing the results of the new algorithm (perhaps sell part of the winners and replace the losers)
ii) since you are using high stock rank which includes momentum which needs benefits from frequent rebalancing and value which takes times to work, it must be difficult to work out the optimal frequency which which the new algorithm should be implemented. I very much look forward to the results of your study of this problem!
How does this tie into the USA markets? Do you have a parallel article for the stocks included therein? I enjoy your style of writing.
Best Regards,
Ron
I've been planning to launch international versions of the NAPS Portfolios for all Stockopedia's covered regions, but we've been resource constrained in terms of team size.
I'm hoping that we can deliver it within 12 months plus backtested results. It will be a combination of adding more automation on the portfolio construction side, as well as more editorial & research support.
I think the European ones work very well, I have bought quite a few in the last 8 months, however quite a number (probably over 70%) are not available through my UK broker, even some French and German companies, it will be no use including companies that people can't buy. That was my biggest frustration when adding European shares to my Stockopedia subscription, so much choice but many not available. Looking at the screens the European stocks seem to generally outperform the UK ones and are slightly better on the performance stats but the USA 90-100 is not performing so well.
I thought rebalancing was just selecting the top ones in each sector, if so why replace shares with lower ranked ones? Also I don't think it has been mentioned but Central Asia Metals (LON:CAML) dividend is about 7%.
Thanks. As always a very interesting read.
When it comes to re-balancing what do you do if something still meets the qualifying criteria that you originally used? So, for example, if I bought Somero Enterprises Inc (LON:SOM) in March 2016 because of its high Stockrank score and it still scores 97 today would you sit on your hands?
Or, to pick an example from the other, rather less pleasant, end of my portfolio, what if you bought Cambria Automobiles (LON:CAMB) in March 2016 because of its high Stockrank score and it still scores 86 today?
I'm not fishing for advice because I know that isn't the purpose of this site. But an in-depth understanding of the re-balancing concept has always eluded me.
My view would be something along these lines:
First imagine that you have chosen a single stock for your portfolio which meets some set of criteria which you hope will produce high returns with low volatility (uncertainty). You might pick right, but there is a risk that you choose Petrofac (LON:PFC) rather than IQE (LON:IQE) .
So you decide to choose two stocks using the same rules. You do not know which might perform better than the other so you put the same amount of money into each. By choosing stocks from different sectors/sizes/risk profiles/etc you hope to reduce the overall volatility of the portfolio without diluting the returns too much.
Clearly you can repeat the process to create a portfolio of ten or twenty stocks or more. But clearly there comes a point of diminishing returns. Each new stock needs to offer the prospect of significantly above average returns while being diversified from the others to justify its inclusion. (If it is too correlated with other stocks you gain very little by choosing it. It won't reduce your exposure to market risk enough to justify the risk that it under-performs its peers.) So at 10-20 stocks you stop adding stocks. In this simple approach you have no reason to prefer any stock over the others so you create an equal weight portfolio.
Now, as you say, the big question is what to do when you reach a rebalancing point (and why rebalance at all?) My personal answer is basically that I want to get back to the point where I have an equal-weighted portfolio of stocks with similar future prospects. So any stocks which have performed well and continue to show up in a screen for my criteria should stay but be top-sliced. They are top-sliced because although they have performed well we do not want to over-weight any stock as we have no reason to justify that.
For stocks which have under-performed there are two possible responses. If they still meet the screening criteria we could top them back up to equal weight. However, psychologically if not for any other reason, this can go against the grain. (If they no longer meet the criteria then topping up rather than jettisoning is not advised.) So an alternative is to switch out stocks which have under-performed and replace with stocks from the screener. Even if a stock still meets the screening criteria it is valid to replace it with what should be a stock with similar future prospects. We are simply switching our bet to avoid the risk that the stock has fallen for reasons we don't understand or even for a change of view. If you think of each stock in terms of the probability that it contributes a gain to the portfolio then swapping to a new stock with similar properties is completely acceptable (provided you are happy about the transaction costs involved.)
Which leads on to the idea that it is the "portfolio" that is the object that you are nurturing rather than individual stocks. So it is the expected return and volatility of the portfolio (as a whole) and not individual stock returns and volatilities which should occupy your attention (rather like a multi-celled animal where it is the animal not the individual cells that you care about.)
Hi Ed
Excellent write up as usual. Many thanks.
Your evolutions of the NAPS screening process resonates a lot with me.
Using a great deal that is offered on SP (Stock reports & stock ranks, tools, NAPS/SNAPS thinking, articles, tools & community commentary), to guide my buy/sells I find that my portfolio looks a lot like your size, stock rank & risk rating mix which you portray in pie charts above.
Also, in line with your comments, my portfolio is less volatile than the FTSE100 (I track against this for historic reasons, I should switch to the All Share) and my portfolio performance since I began using SP in June 2015 has beaten the FTSE100 comfortably.
Thus, from this experience I think your NAPS changes will be very useful and I look forward to seeing how things evolve over the next period.
Regards
Howard
Thanks, always an interesting read.
Some of the switches look a bit odd on the face of it, with higher stockranked companies being replaced by lower ranked companies:
I appreciate some of this may be down to the new desire to have a balance of risk ratings and market capitalisations, but that's not so in the case of CAML being replaced by IGR, both of which have identical risk rating classifications.
Is it down to small changes in the stockranks between the analysis being carried out and the article being published? If so, it hardly seems worth incurring the transaction charges given the seemingly marginal differences between the stocks being swapped.