The 1973 Bear started on the 4th May 1972 and reached the bottom on 6th December 1974, some would say the bear lasted 30 months. But that isn’t the way I experienced it or any other bear market since. At the bottom the investor was sitting on a 75% loss which took a further 32 months to recover and only then if they were nimble. The actual period for the market to break through the 1972 top was 12th March 1981 a total negative period of almost nine years.
The 1987 Bear started July/87 reaching the bottom 10th November 1987, the break above the all-time high didn’t come until 13th March 1991 shall we say forty months later. It was even worse for the 2000 Bear which started December 1999 and didn’t recover until November 2016, almost sixteen years later. But let us assume that the FTSE is not indicative of todays market and use the FTSE 250 which is more realistic.
The Bear started in August 2000 bottomed out on the 17th March 2003 and recovered the loss on 9th June 2005 a duration of just under five years. However, it collapsed again two years later 15th May 2007, hit bottom in November 2008 but didn’t recover until a little over four years in January 2013.
When you hear the top fund managers and journalists together with some on this site tell you to hang on to your portfolio because bear markets last a short while, consider the position carefully. It is mostly said by those who have more than money to lose, credibility. In the investment business credibility is in some respects more important than anything else, because without it you are out of a job and that goes for journalist and tipsters.
In some respects, they are right: Market timing is notoriously difficult, and I should know as I made a career out of it whilst handling other people’s money. If you are “out” and the market is going up your investors will find someone else to handle their money, usually just as the market tips over into the bear. Now they have lost the last ten percent at the top plus the fall, no wonder investors get upset and don’t re-enter the market until the bull run is once again almost over. So doing…


The US experience concurs with your comments, Ken.
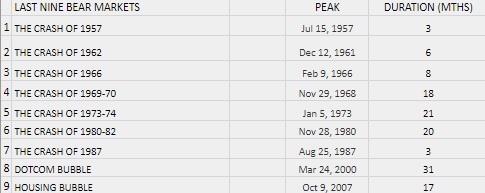
The S&P-500 has experienced nine bear markets in the last 60 years, of durations from 3 to 31 months:
The blue line in the graph below aggregates these nine bear markets (& subsequent rallies), starting from 125 days prior to each of the nine peaks that preceeded each bear market.
Similar to the UK performance, the S&P-500 has (on average) failed to exceed it's prior peak even after 800 trading days.
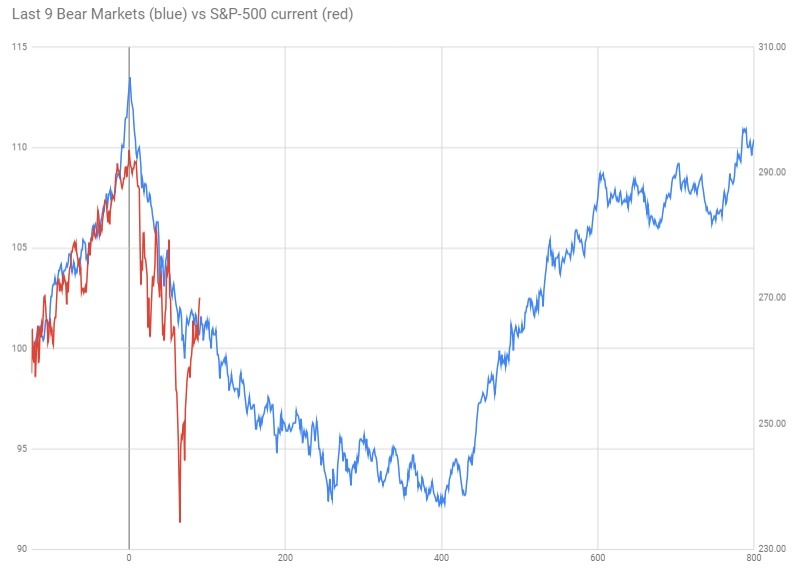
The red line superimposes the current S&P-500 performance, also starting from 125 trading days prior to the most recent peak (peak in mid September 2018).
The chart suggests that on average bear markets bottom around 400 trading days after the peak i.e. 18 months.
This would suggest a bottom for the S&P-500 not until the First Quarter of 2020.