The SIF Folio unpicked: What I do and why I do it

Since launching the SIF folio in April 2016, I’ve added 64 stocks to my Stock in Focus fantasy fund, sold 45 of them, and written 118 weekly columns.
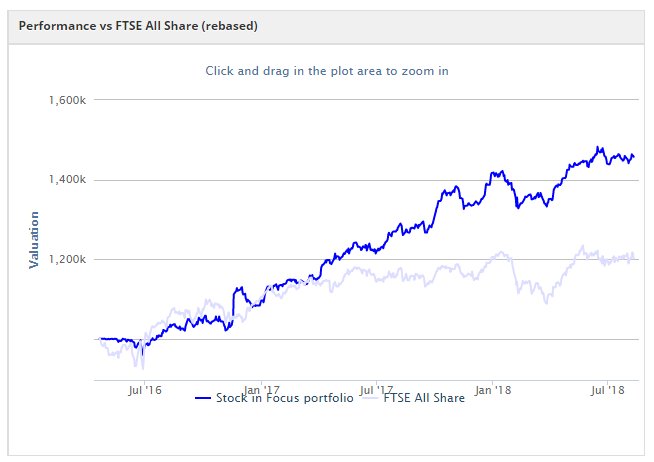
The value of the fund has risen by 41% plus dividends over the last two years. This compares fairly well to a gain of 13% plus dividends for the benchmark FTSE All-Share index:
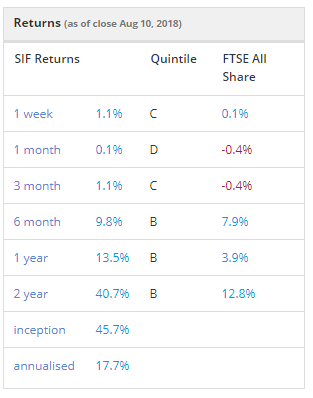
SIF is certainly not the best-performing Fantasy Fund on Stockopedia. But what it does offer is a clear set of rules for selecting stocks, a high level of documentation, and as much transparency as I can manage.
Every trading decision I make is documented in my weekly articles. And the screen I use to select stocks is also available for other community members to view and adapt (the Stock in Focus screen is here).
For the last 16 months, I’ve also been buying each new stock selection for my personal holdings. So the SIF fund manager has some skin in the game too!
Shares Awards: If you’d like to help support Stockopedia, you can vote for us in ‘Best Investment Software Programme’ (Category 15) and 'Best Customer Service’ (Category 7) at the Shares Awards. Here’s the link.
Don’t lose money
When I started the SIF portfolio, my goal was to develop a set of rules that would select affordable growth stocks with good fundamentals. I wanted to avoid stocks that needed a lot of individual research, such as special situations and pure growth plays.
At the core of my thinking was Warren Buffett’s first rule of investing: don’t lose money.
The idea was that by avoiding big losers, I’d be able to beat the market without needing to take too much risk.
This may sound boring, but it has worked well so far. The 45 stocks I’ve bought and sold since April 2016 have delivered an average annualised total return of 31% (including dividends and costs). However, I’m painfully aware that my system has yet to be tested in a bear market.
How my rules work
I’ve received a number of questions about the rules I use in my screen (which you can see here). So I’m going to include these in full, and spend a little time explaining the thinking behind them.
Market cap of at least £50m and bid-offer spread of less than 4% - In my opinion, micro-cap and illiquid stocks generally need detailed research and long holding periods to achieve good results.
A rolling forecast P/E of between 5 and 30 - This rule was designed to be a simple way of ruling out ‘hot’ growth stocks and deep value stocks/value traps.
Earnings yield of at least 8% - this ratio is calculated as EBIT (operating profit) divided by enterprise value.
In my view, this is one of the most useful metrics around. It shows how much profit a company is generating for its owners, independent of tax and debt/equity structure. Unlike operating margin, this gives us a good idea of the kind of returns we might expect from a stock.
Forecast dividend yield of at least 1.5% - For a profitable, well-financed company, I believe a dividend is a useful indicator of cash generation and financial discipline. I discussed dividends in more depth back in June.
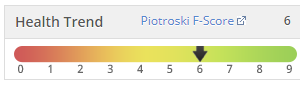
Piotroski F-Score of at least 6/9 - this is a great tool, in my view. It provides a snapshot of a company’s fundamental health, cash generation and profit growth. If you’re not familiar with the F-Score, I’d encourage you to drill down into this rating on any StockReport page, or read more here.
Net debt less than four times trailing net profit - Excess debt lay behind the recent failures of Carillion and Conviviality. But many more companies survive debt-related meltdowns by swapping debt for equity and diluting their original shareholders to oblivion. I’m keen to avoid this fate.
I usually compare debt with net profit, rather than the more commonly used EBITDA. I think net profits provide a better indication of how quickly a company could repay its debts, without having to make damaging cuts to spending.
Rolling PEG ratio of less than 1.2 - Made famous by the late Jim Slater, the rolling PEG (price/earnings growth) ratio is one of my favourite growth metrics.
The premise is that a faster earnings growth justifies a higher P/E. The PEG ratio enables easy comparisons between stocks.
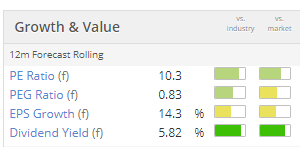
Rolling forecast eps growth of more than 5% - Inflation means that a certain amount of growth is necessary to stand still. I’m looking for companies that are actively expanding, so I’ve specified minimum expected earnings growth of 5%.
Forecast sales growth above 0% - As above. If sales are falling, it usually means a company is shrinking, restructuring or having problems.
At least one broker estimate - some small caps don’t have broker coverage. This means no consensus forecasts are available to satisfy my rules. I exclude these companies.
1-year relative strength (RS 1y) greater than 0 - relative strength measures the performance of a stock relative to its index. A positive value means that the stock has beaten the market over the period in question. This is said to be a useful indicator of momentum.
Price/book ratio greater than 0 - stocks with a negative book value usually have dodgy balance sheets. For example, they may have a massive pension deficit. I prefer to avoid situations like this.
Holding period: All stocks are held for a fixed minimum of nine months before being reviewed. If they still pass all of my screening rules at that time, they remain on the portfolio on a rolling monthly review. If they don’t, they’re sold.
Stop losses/top slicing - I don’t use stop losses at all. I’ve never had good results with them personally. I rarely sell early in SIF -- when I have done, it’s usually turned out to be a mistake.
The only time I will top slice is in the unlikely event that a stock doubles in value. In that case I’ll sell half the holding, so that I’m guaranteed a profit.
Of course, having a set of rules is one thing. Living with them is quite another. So how has my foray into systematic investing worked out?
More comfortable than I expected
I think this approach suits me. On the whole, I’ve quite enjoyed following a rules-based strategy. It makes the research and selection process much more manageable and it’s the best way I’ve found to make consistent decisions over long periods.
Another advantage is that because the timing of buys and sells is controlled by my rules, I’ve found that I focus more on the investment process and less on returns. It also feels easier to sell losers and hold onto winners.
Still some challenges
From time to time, the SIF rules have led me to select stocks or sectors I would otherwise have avoided. Examples include late-cycle housebuilders (most recently Bovis) and CFD firm Plus500, which is currently the portfolio’s biggest riser.
However, these situations have generally turned out well. So I’m becoming more comfortable with them, hence last week’s purchase of Bilby.
The biggest challenge has probably been accepting that some opportunities aren’t a good fit and can’t be acted on. For example, in the wake of the Brexit referendum, I thought there were a lot of bargains on offer. But negative relative strength ruled them out of the screen. Similarly, multi-bagging growth stocks such as Boohoo and Fever-Tree have also been ruled out.
What next?
The SIF rules won’t suit everyone and can probably be improved on. But I’ve found a lot of satisfaction in following a rules-based process. I’m looking forward to learning more as the fund continues to evolve.
As always, I’m grateful for your readership and feedback -- the quality of discussion here on Stockopedia is always very high, and adds huge value for the community.
Disclosure: Roland owns shares of Bilby, Bovis Homes Group and Plus500.
Disclaimer
This is not financial advice. Our content is intended to be used and must be used for information and education purposes only. Please read our disclaimer and terms and conditions to understand our obligations.

10 comments
Mr Roland: What impresses is that:
(1) you adopt a rules based approach
(2) you have the discipline to keep to them. You have given careful thought to the rules. You accept other rules may be useful, but you do not make the mistake of subjectively bending your rules because 'this looks good, but I need to squeeze it past my rules'.
thank you for post and taking time to do,, whether peeps decide on this or not its great to add to other strategy,,i will take on board and and with other advice to tweek what i think is right,, but we are all different investors,, high risk/ low risk.... so depends on the person,,,
Excellent. The proof in the pudding will be how your strategy holds in a bear market.
I am looking for a strategy to cope with a forthcoming downturn, especially since central banks are tightening and corporate bond yields are so low. Any views?
Best
Simon
Roland, Your SIF portfolio has made a truly impressive return of 41% in 2 years (18.7% P.A compound).
Why don't you apply these same principles and become one of the UK's most successful fund managers?
Great post Roland aleays pick up a couple of nuggetts from your posrs.
Thanks for your latest SIF post. I find all of your blog posts a good read... although I akip through the international shares, as I don't feel able to affordably invest in such companies. I think a well defined set of rules for investing is essential - I don't consider it is easy to figure out for certain the detailed "workings" of many companies, and so a well defined and refined set of rules take a lot of "guesswork" out of investing.
I am currently setting up a few mirror portfolios with certain rule sets and monitoring them over time.
One question I have is with regard to forecast revenue growth, as a figure 'greater than zero' seems quite lenient. In my own mind, if revenue growth trails profit growth then in simplistic terms this seems due to improving margins, reducing costs, realising cost benefits through takeovers, etc. But all of these factors to me do seem to have a finite life span before eventually all of the juice will be squeezed out of them... unless I suppose a company keeps on taking over others and repeating the process. Ideally I would look for forecast revenue growth of at least half forecast profit growth.
Roland
Great article. A couple of follow up questions
Given your preference for companies for strong cash flows it is a bit of a surprise that there is no explicit cash flow related rule. I use OCF/EPS but this has limitations because as far as I can see I can only get a 1 year figure in a Stockopedia screen and I would rather look at this over at least a five year period
It is interesting that you use earning yeild as your main measure of profitability rather than the more popular ROCE and op margin metrics. Assuming a company has no debt, EY measures profitability on market cap and can therefore be heavily affected by share price movements and doesn't necessarily measure how well management is managing capital. IMHO EY is more of a valuation metric.
I have previously had some scepticism with the F score in part because different outcomes can result depending on the data provider used. Also small differences can reduce the score by several points e.g. NXT, which I recall is a personal holding of yours but not in SIF, has a 5 but very closely misses a 7. On balance I do think that the F score is a good tool but I would use it after I had derived a screened shortlist.
Still not sure that selecting a nine month hold period is optimal but in the absence of an alternative approach seems to work. I am starting to experiment with a dual screen approach. Two sets of rules, very similar but with one screen more tightly derived than the other. The tight screen which will by definition have fewer stocks is used to pick purchases whilst the looser screen (particularly in terms of valuation) is used to determine whether to continue to hold
Like you I am happy to miss out on Boohoo (LON:BOO) and the like as the risks and work in identifying the wheat from the chaff of high growth small caps exceeds the return that you can get from a 'duller' factor based approach. Also agree with you on stop losses. For those looking at the longer term, investment decisions should be based on fundamentals not short term SP movements (unless of course the latter has been caused by the former!)
Hi merlotman,
Thanks for your feedback. I'll try and address your points as well as I can.
Cash flow: I always pay close attention to cash flow when reviewing a stock, especially to the free cash flow metrics used in the ValueRank and QualityRank calculations.
One reason for not including it as a specific metric is that as you say, one-year cash flow can be quite lumpy. There's often a good reason for this, so I wouldn't necessarily want to rule out stocks on the basis of one year's poor cash flow.
Earnings yield: I do view earnings yield as more of a valuation metric, but one which indicates the potential profitability (returns) on my investment. My point is for equity investors, valuation and profitability can be linked. A company that's overvalued may deliver below-average returns, even if it has attractive profit margins. As my focus is on a relatively short holding period, I think that achieving an attractive entry point in this regard is important. Over long periods, I agree that ROCE might be more relevant.
F-score: When you're using a data service, anomalies in the data are inevitable. This is true even with a high quality feed such as that the Thomson Reuters service used by Stockopedia.
I do find and highlight such anomalies in my articles sometimes, but only rarely do I think that they change the overall picture on a stock. I can live with the risk that periodically a stock might incorrectly be included or excluded from my screen.
Incidentally, I no longer hold Next (LON:NXT) shares.
Your suggestion of a tight screen and loose screen to decide on which to hold is something I've considered too. I do already have a loose version of my screen which I sometimes use to find buys when the market is roaring ahead. I'm still mulling over whether to use this as a selling guide. I'm not convinced it would improve my returns but have not yet managed to gather conclusive (quantitative!) evidence either way.
Regards,
Roland
Hi Roland. I'm very interested in SIF as I'm especially interested in Warren Buffett''s second rule of investing (dont forget rule one).
I like the fact that its lower risk for medium returns with low maintenance.
Hi Roland,
Really good article, enjoying the weekly updates for the SIF portfolio. It is a great example of how to set out your own rules and strategy in a disciplined manner and your breakdown of stocks showing all the stockopedia indicators is very helpful when it comes to doing your own research.
I've been following lots of the shares included in the portfolio closely, in the monthly reviews it is useful to have comparisons in the metrics that have changed between when you bought the share and come to sell it, learning a lot from this and the more detail you can go into here the better!
Keep up the good work,
Josh