Back in May, a piece titled “Didn’t buy Warpaint? Why clear uptrends are the best uptrends” hit a nerve. If you missed it, here’s the gist: You often don’t buy the stocks you want to because they seem to be in a perpetual uptrend — only to regret it as they keep climbing higher.
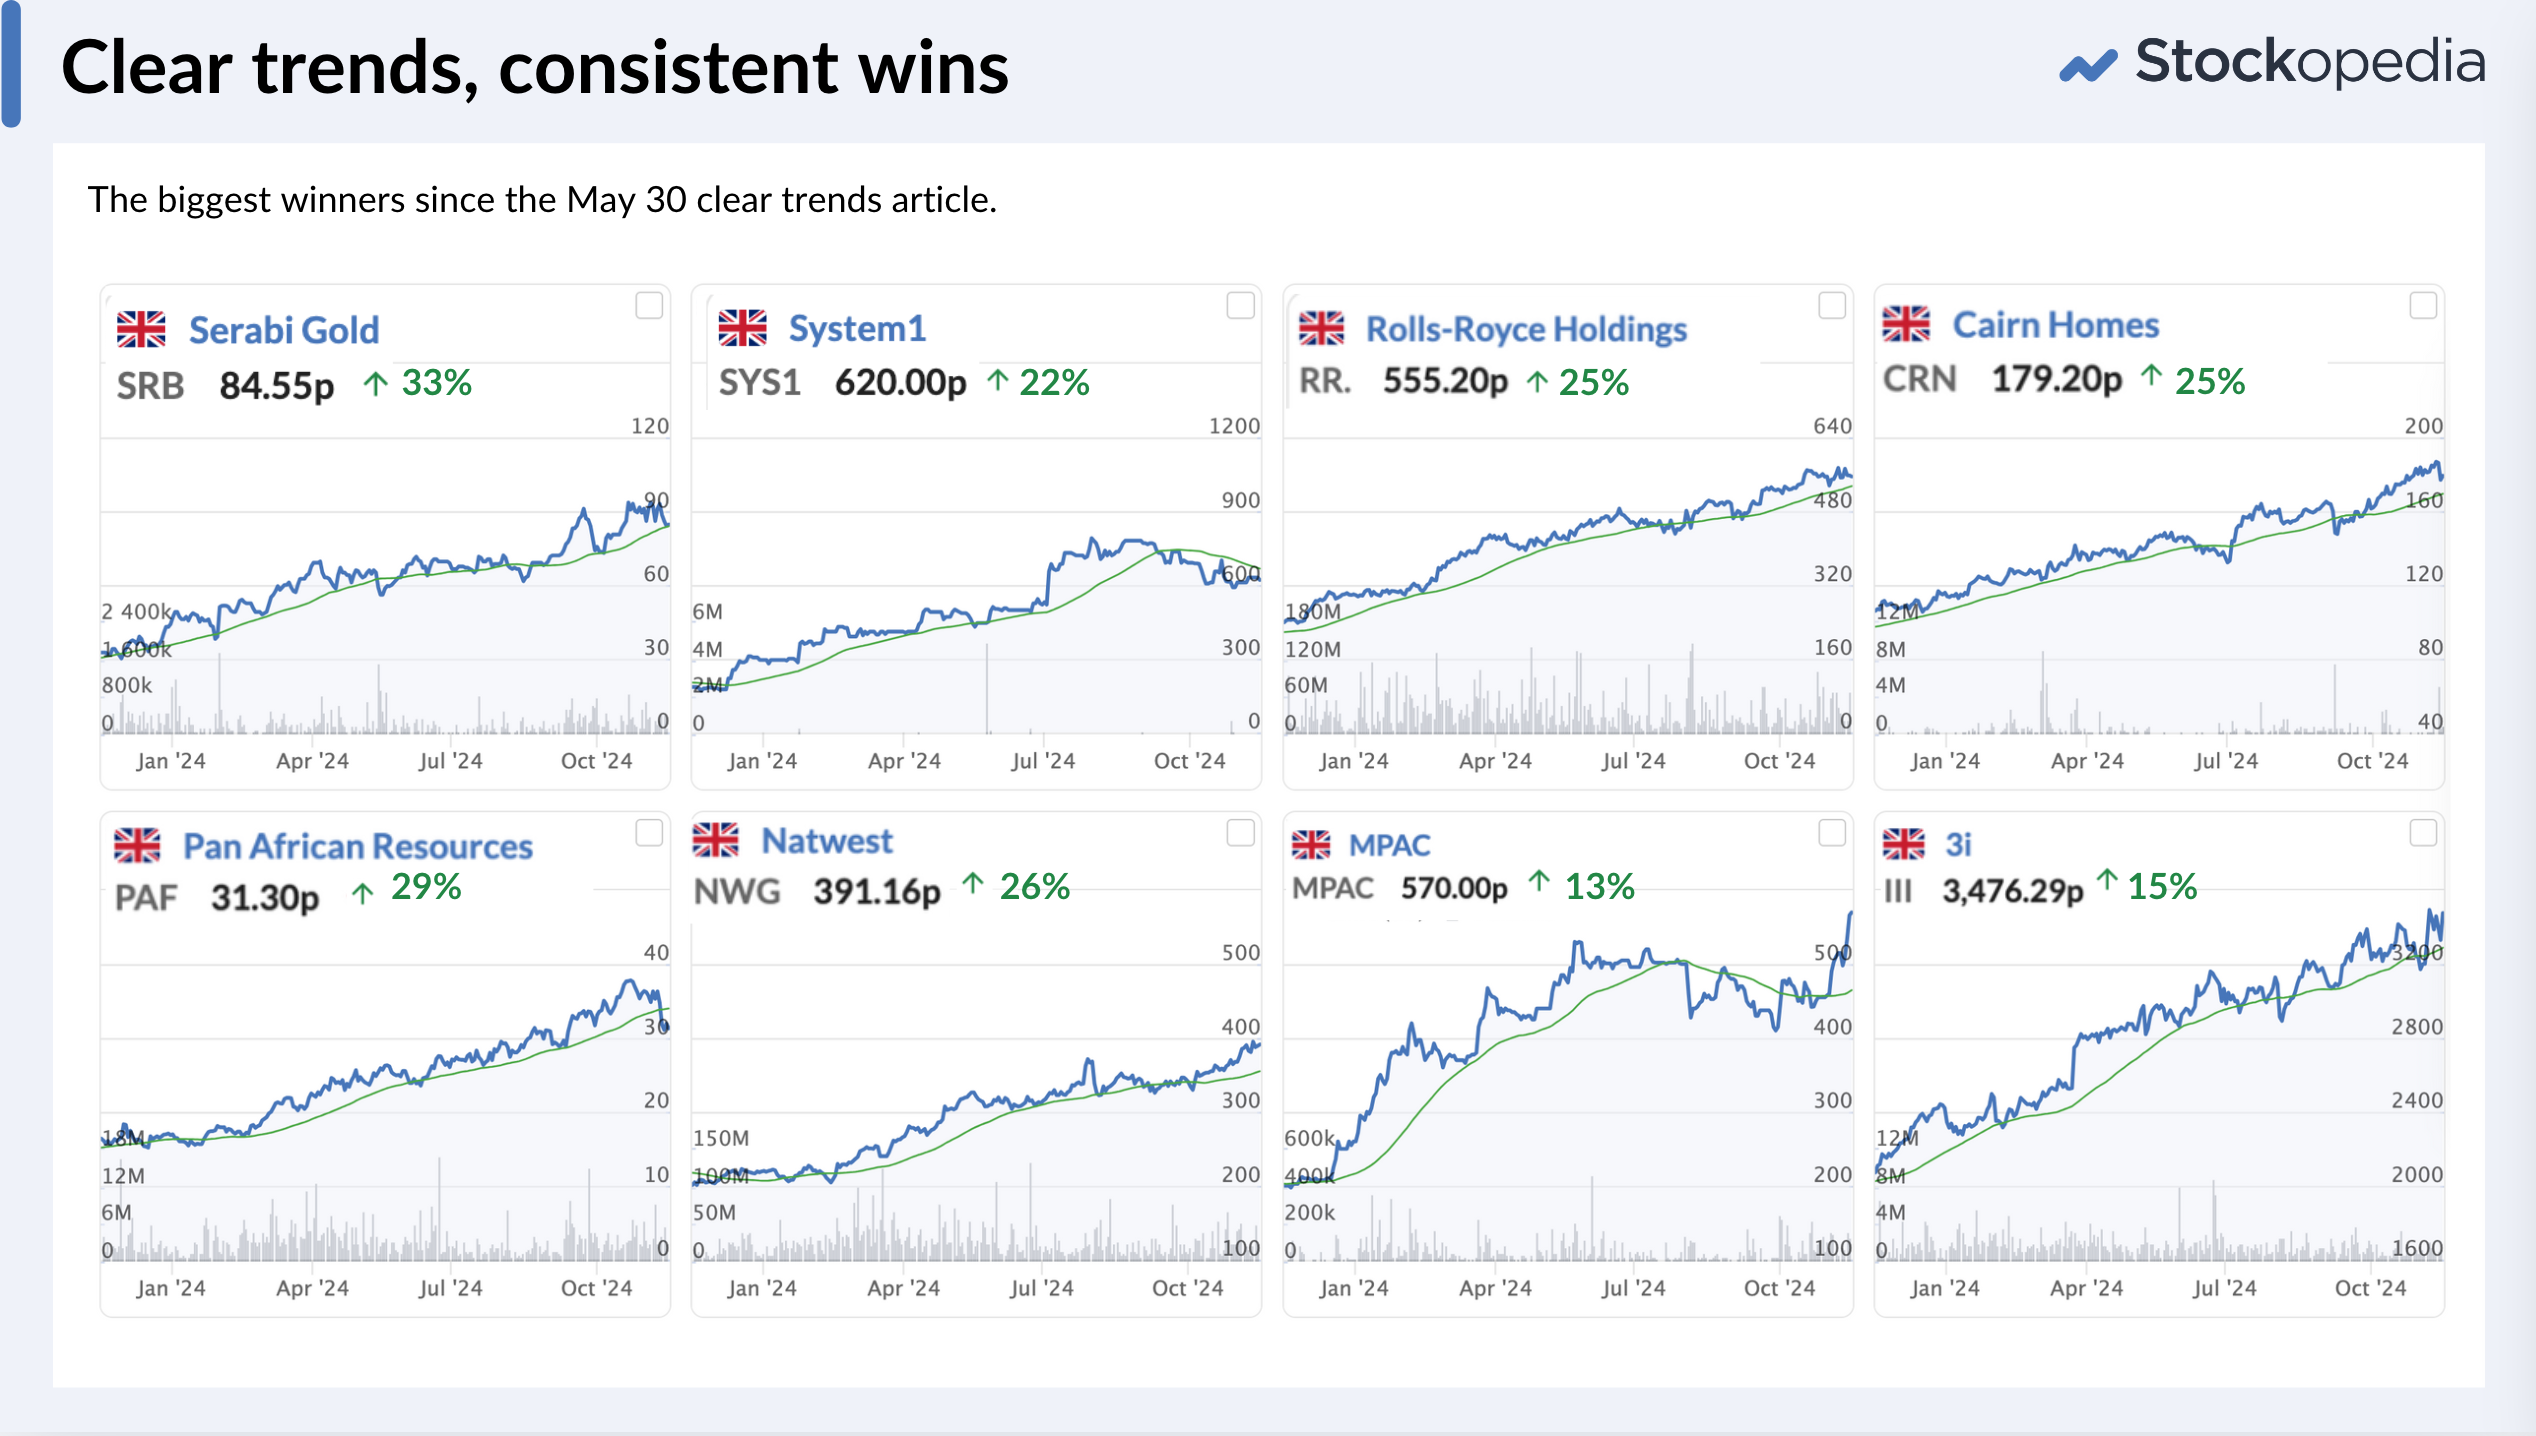
This is the power behind “clear trends”. Clear trends are powered by consistent but not excessive buying, with holders who aren’t rushing to sell. They show few significant corrections and on average continue to outperform. The 20 stocks mentioned in the original piece have powered on by an average 8% in less than 6 months, while the 90+ StockRank set is only up 1.6% and the FTSE All Share down 2.8% over the same period (AIM down -9%).
Strength begets strength. Not in all market environments, but much of the time. Here are a few of the top performers from that May list.

Even more powerful in small caps
Since then, I’ve become even more convinced of the power of clear trends. Clear trends not only improve the performance of momentum portfolios, but they especially enhance the returns of small caps.
I recently back tested some simple trend clarity rules on small caps, covering 11.5 years of market data:
- Market Cap between £20m and £350m (i.e. small caps)
- StockRank at least 75.
- Stocks among the top 20% price risers over previous 12 months.
- Sorted by trend clarity. (For maths wonks - this uses the R-squared of a linear regression on the share price over time)
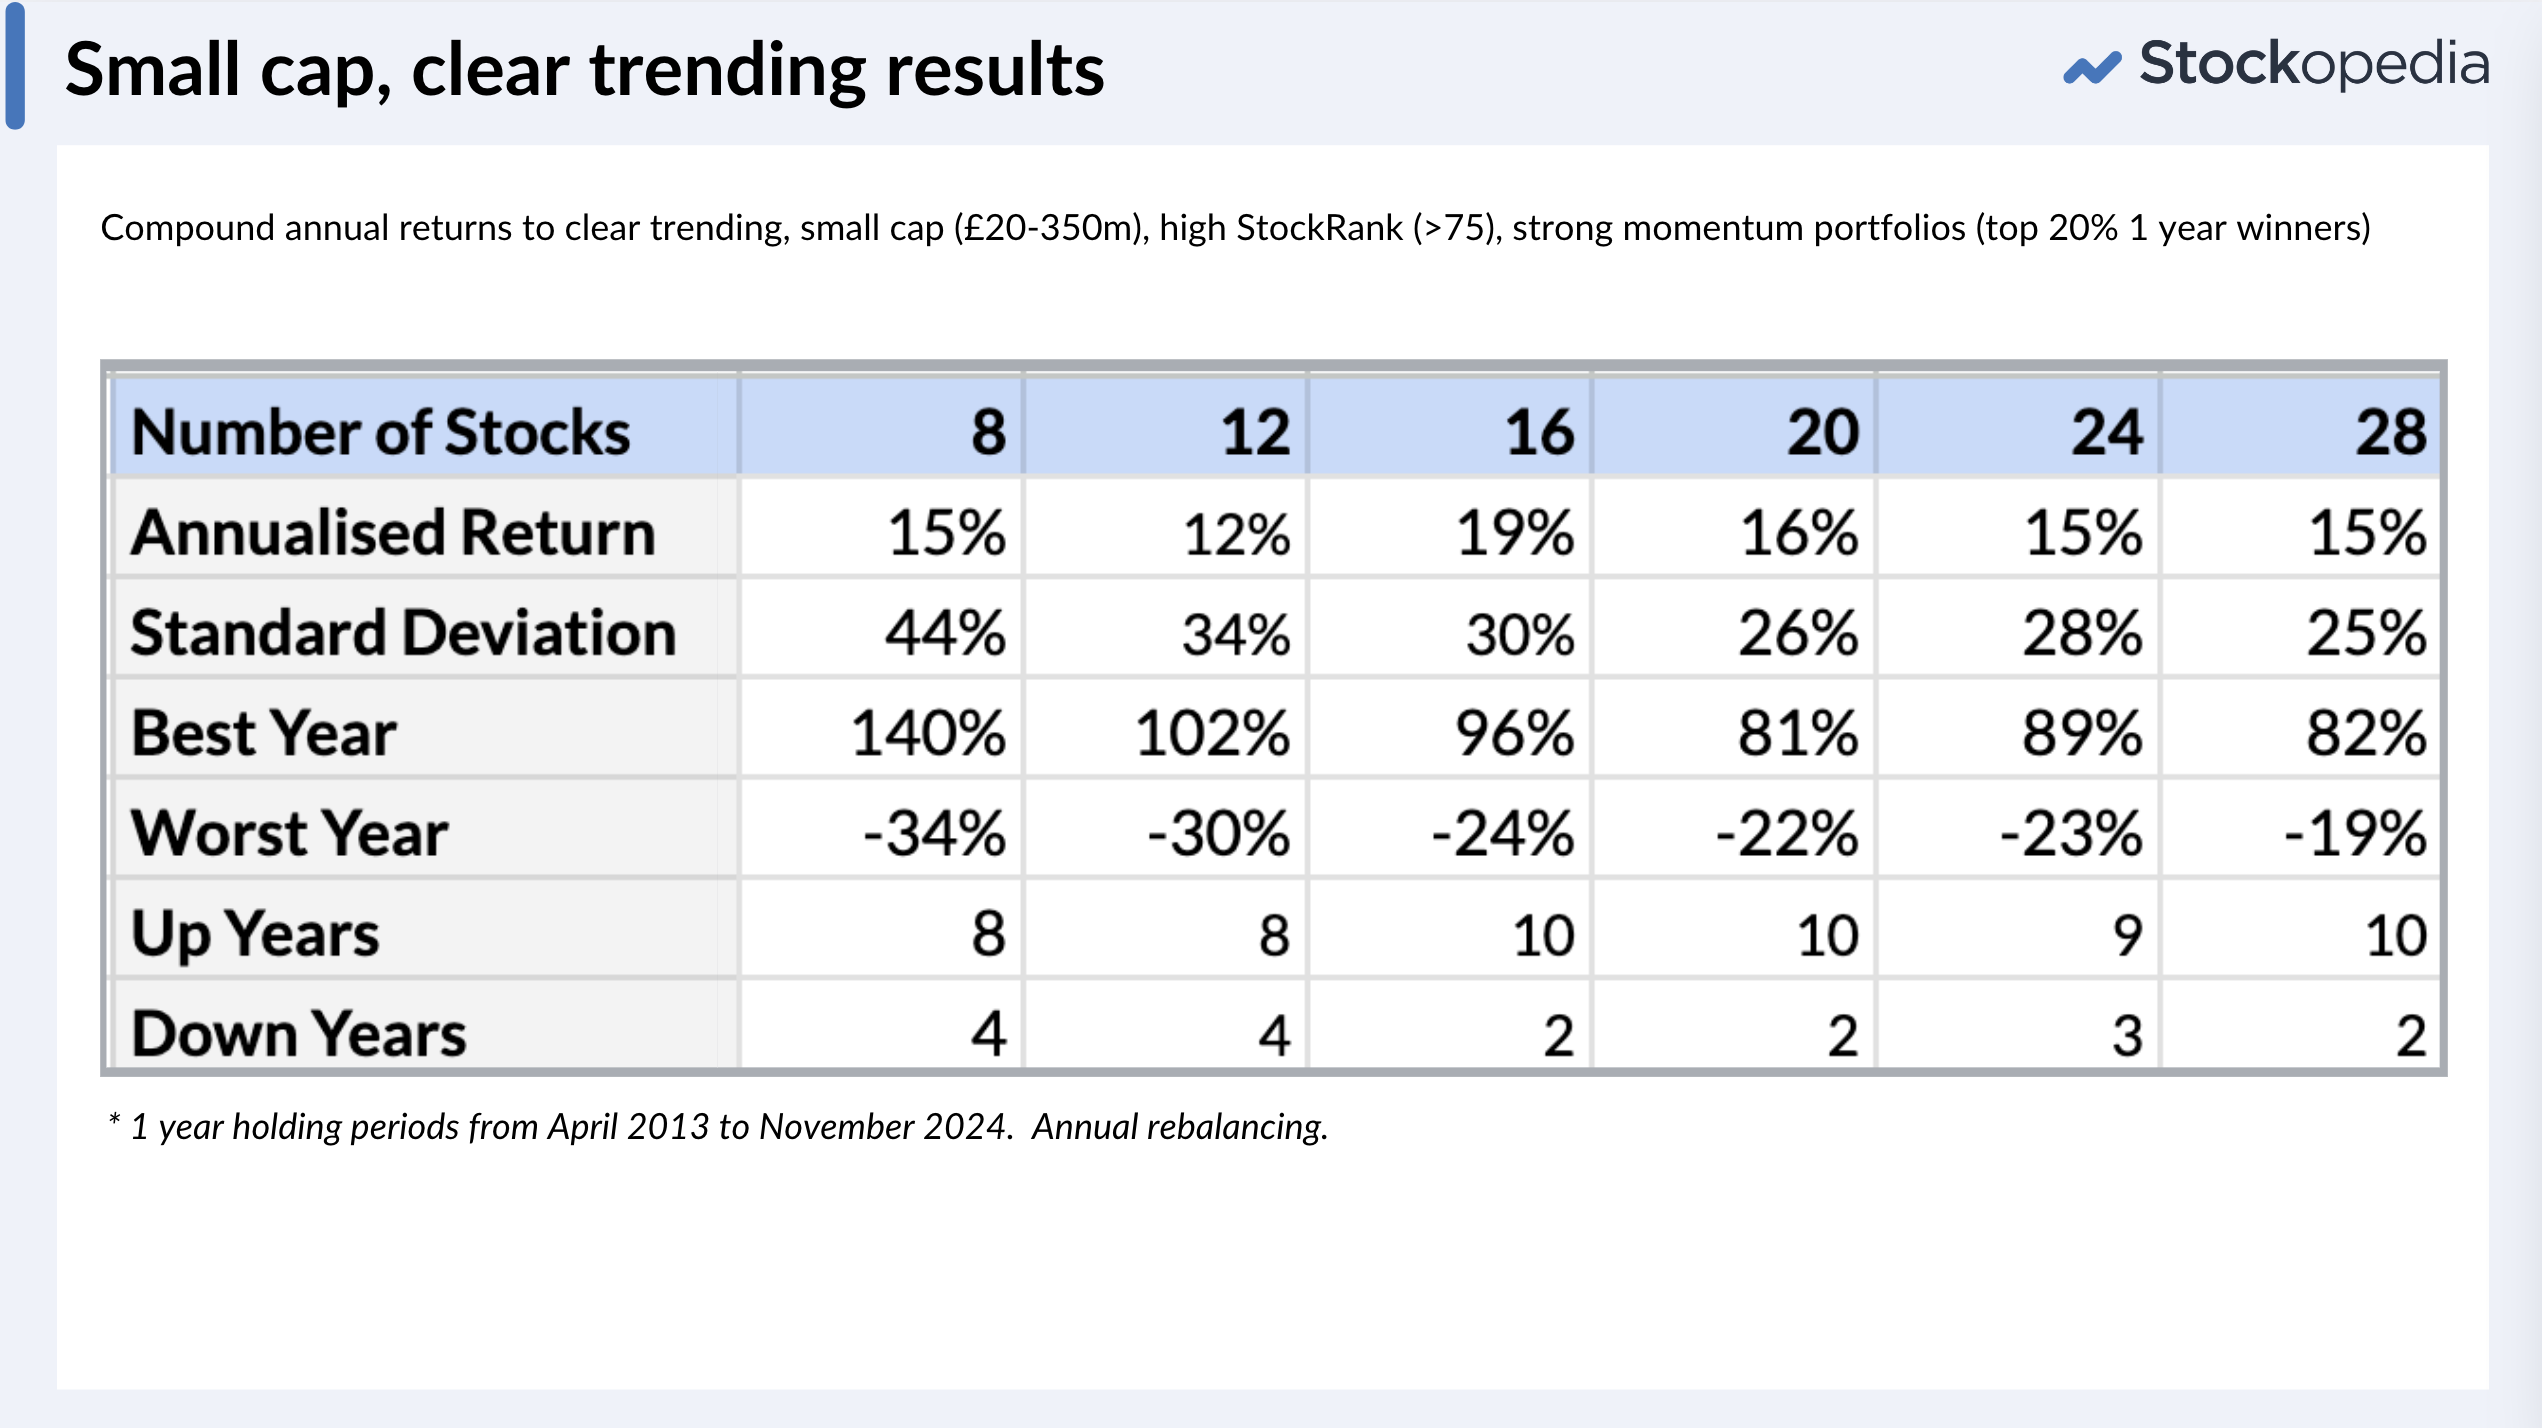
Here are the results for portfolios of different sizes, rebalanced annually since March 2013:

The returns are strong, typically 15%+ annualised over the period, and reaching over 19% for the 16-stock portfolio. Risk and return seem optimal with portfolios of around 16-20 positions, showing 10 up years and just 2 down years. Concentration was not a benefit with this approach.
Admittedly, the bid-ask spreads can bite in small caps and liquidity can be an issue - dealing costs can be high. The current portfolio has an average bid-ask spread of 2.6%, which is only partly offset by a 1.1% dividend yield. After all costs (including 0.5% stamp duty), there would be at least a net 2% drag on performance. Nonetheless, factoring that in…


