If I see on the new 'Trading information' pop up:
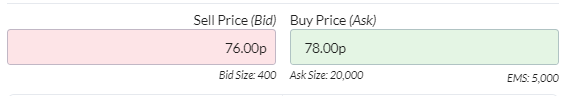
is this in effect saying that there are orders from someone sitting at these levels?
In this example would it, in isolation, be interpreted as bullish?
Is Level 2 just more detail of this sort?
If I see on the new 'Trading information' pop up:
is this in effect saying that there are orders from someone sitting at these levels?
In this example would it, in isolation, be interpreted as bullish?
Is Level 2 just more detail of this sort?

To answer my own questions after a bit of googling:
is this in effect saying that there are orders from someone sitting at these levels? In this example would it, in isolation, be interpreted as bullish?
Yes and Yes.
Theory indicates that this can show potential demand/supply and probable price direction. For this specific example, theory was wrong.
Is Level 2 just more detail of this sort?
From what I can determine. Yes.

Hi HumourMe,
Not really my area of expertise, but as I *think* you've made a mistake in the above, I thought I'd question it.
Surely this pattern is NOT bullish.
If you want to sell any stock, the most you will be able to get rid of is 400 shares for 76p, if you want to sell anymore than that you'll have to accept a lower price.
However, if you want to buy stock you can get up to 20,000 shares for 78p. (If you want more you'll have to pay more).
So that looks "negative" to me??
(I think you imply that this subsequently went down? In which case this might have been predictive).
As I understand it "Level 2" will give visibility of the depth of the order book.
So there might be a second buyer prepared to take 100,000 shares but only if you accept 75.9p and if there are no other sellers other than the 20,000 offer (or if all the other sellers are only prepared to accept a much higher price) - that might give a more positive message.
As I say, not really my area, but hopefully if I've horribly misinterpreted someone will come along and point it out. Also I have no really idea how much benefit this really can be to an investor (quite low down on my priority list to find out - so implicitly I am guessing - not much).
Quite happy to be challenged, not least because I don't understand it. The information is presented and like most TA (and FA) I wonder if I can make use of it. Your interpretation makes sense.
I came across it when exploring the new site; my broker also thinks it relevant. I'm on the fence :-)

As I still use the 'old' system I had not come across this before so thanks for pointing it out.
I went to the new on Friday morning when I was looking to buy Strix (LON:KETL) and this was the picture:
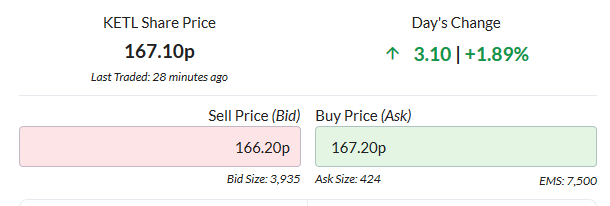
I could only get an electronic quote for a small number of shares - anything larger was "by negotiation". Then at 11 58 an AT was reported taking out the 424 at 167.2 and the ask went to 170. I could then get quotes for several thousand shares at 169p.
This was a good illustration of the relation between Retail Service Providers (with whom you deal unless you can access the order book) and the market. They used to be called "Market Makers" but are no longer.
So a couple of points I learned from this-
1) the figures on Stocko are 15 minutes delayed
2) unless you have full-blown level2 you don't know what lies behind the figures - a large number at 168 or 169 or 170?
3) Although the answer was 170 the RSPs were willing to deal at 169 so that still raises some questions for me about how they work in relation to the order book.
4) Nevertheless, seeing the 424 on Stocko did explain why I was unable to get a quote for more than a handful while that was sitting there.

Hi HumourMe
Not to put too fine a point on this in my view trying to invest intelligently and profitably without level 2 is the equivalent of trying to walk across a motorway with eyes shut using a white stick.
Understanding how the share price you are monitoring fluctuates intraday and over a longer time period/s is crucial to timing your buy and sell times. Some understanding of how it moves with respect to moving averages is also needed. I use 200 day and 20 or 50 day moving averages. Some people use Bollinger bands.
I use this information to time my buy and sell points. I choose stocks I want to buy such as asset class type of business etc,and research their fundamentals and maybe do a SWOT analysis. By and large I like shares which have tangible products, have sustainable competitive advantages, and ethical management. Senior management needs to understand the business.
There is no doubt some of the best profits are to be made by disruptive startups. I have made my seed money with ARM, IQE and BUR. I have virtually exited the latter two. I am now concentrating on stable stocks with good yield, low levels of debt and market leaders in their segment of the market.
So for oil shares I prefer BP to Shell because their senior management tends to be heavily biased to oilmen who have risen through the business. If I believe in the share and its management I tend not trade it.
At the moment I am about 45% in cash as a buffer against a sudden market correction and so I can pay for some home improvements and honour my commitments to school fees
I personally do not use contracts for difference nor do I short sell.
Hope this is helpful
23 Jez
On a recent Stocko survey concerning L2 I indicated interest but no commitment. I'm trying to go longer term in perspective ... but want to explore all options.
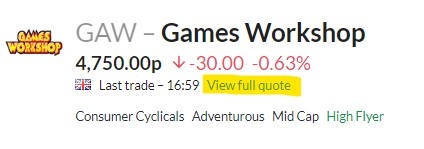
Andy - I've made little use of the full site thus far (keep coming back to the old), but I think there is a link somewhere near the shareprice "view full quote") on the Stock report
I, like Gromley, keep on returning to the old site and probably will until feature parity is achieved or the knockout feature on the new, appears.
However, Gromley is correct:
Gromley old son they should put you on the paid staff found it you were spot on with directions thanks again
I agree with the comments that this would be bearish if it were reliable, which it is generally not. The best bid and ask volumes often change (the more liquid the stock, the more frequently they change) so the Stocko figures are unreliable except for illiquid stocks. Level 2 shows you the up-to-date position, as well as the other (non-best) buy and sell orders, so you can properly gauge the depth of supply and demand at a point in time. For example, if there are large ask/sell orders just above the best ask price then there is overhead supply to work through before the price can move up.
I agree with the comments that this would be bearish if it were reliable, which it is generally not. The best bid and ask volumes often change (the more liquid the stock, the more frequently they change) so the Stocko figures are unreliable except for illiquid stocks. Level 2 shows you the up-to-date position, as well as the other (non-best) buy and sell orders, so you can properly gauge the depth of supply and demand at a point in time. For example, if there are large ask/sell orders just above the best ask price then there is overhead supply to work through before the price can move up.


