Trading the Trend - Timing the market

It’s amazing what can happen in a week. Sentiment changes very quickly. As Ed wrote in his SNAPS column – news can be bad for your wealth.
With recency bias, we place too much emphasis on current events. A good example is Intercede yesterday. The stock jumped on what was a non-RNS.
Here's an extract: “The contract was included within the directors' expectations for the current financial year ending 31 March 2021.”
So if the contract that was announced was included within the directors’ expectations, that meant the RNS was just confirming what the directors already expected.
In other words, nothing had changed. And therefore, in the theory of Efficient Market Hypothesis, this should not have had an effect on the stock.
The stock was up 10% in early hours trading and saw a large spike in the average volume of shares traded.
Was this a coincidence? I doubt it. My belief is that those who read the RNS, placed importance on it, despite it clearly being signposted as not important. That is recency bias in action.
And this week, people are talking about the ‘second wave’. I don’t know about the numbers of deaths because 1) there is no utility for me in following it, and 2) I don’t read or watch news. But some parts of London it would be hard to believe there ever was a pandemic.
Nobody is taking personal details. Almost no social distancing. Does this matter? I don’t know – it remains to be seen. All we can do as traders is to play what is in front of us.
I hope we don’t have a spike in deaths. But if we do, and we also see localised lockdowns hit the economy, and stocks begin to fall again, then it will be time to start shorting and taking advantage of that weakness.
The FTSE 100 fell sharply yesterday, and without wanting to fall victim to recency bias myself, I do think it wise to make sure our exit plans for current positions are robust and that we do not fall victim to a greater peril: the awful “I wish I’d sold but I’m going to hold on and sell at breakeven” illness.
Many say that timing the market is impossible. And whilst I generally agree – it is possible to change your stance relatively quickly. If we have stops in place, and systems in place to flip and go short or long when required, we can catch trends. We’re never going to print the top or the low – and neither should that be anybody’s goal – but we can attempt to ascertain clues from the charts.
For example, if our filter is showing significantly less results than the prior week, that tells us that not as many stocks are within their 52 week highs.
And if not as many stocks are hitting or close to their 52 week highs then it means across the board the market is stagnating. Checking the indices helps but the indices are heavily weighted towards to largest stocks. Checking a chart of the S&P 500 and an S&P 500 chart without the FAANG stocks there is a big difference. The industry stalwarts do the heavy lifting and carry many of the smaller stocks that struggle. Therefore, checking the indices does not always give the most accurate representation of the market.
Here are some results from this week’s filter:
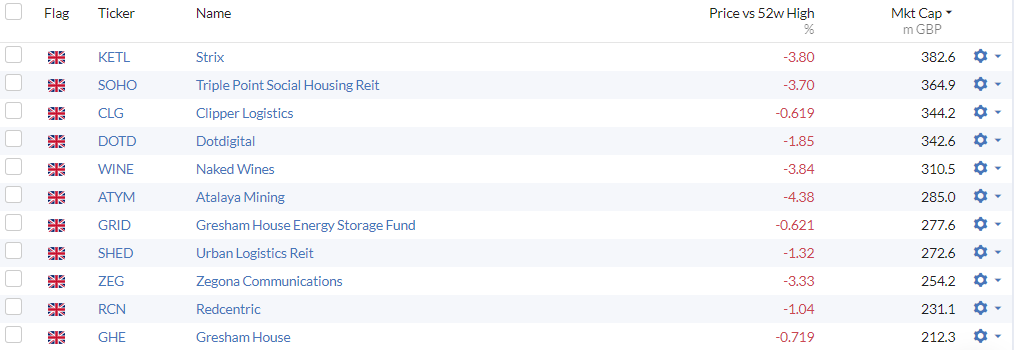
Naked Wines
One stock I hold a long position in, WINE, is mentioned there. I wrote about this stock previously here. Let’s look at the chart.
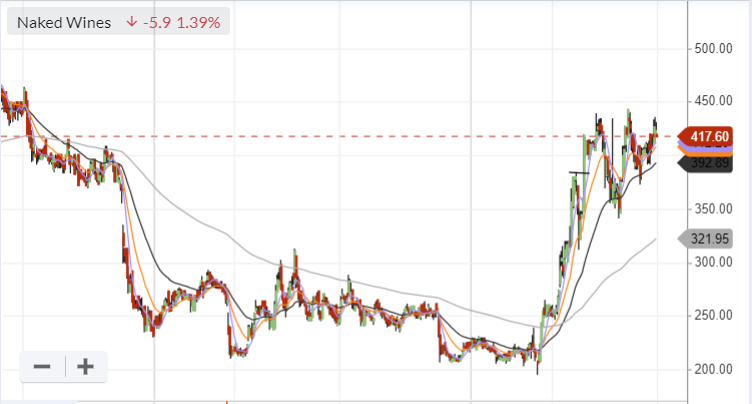
We can see this looks to be a stage 2 stock still. We can see that it has been consolidating in recent weeks.
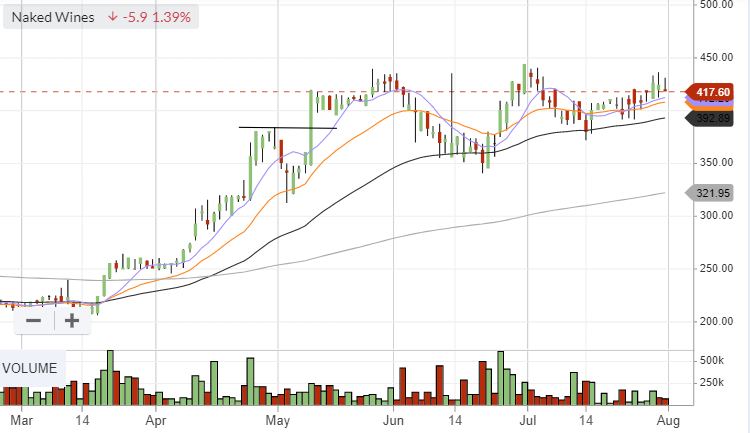
It has the stage 2 classic hallmarks. The stock is putting in higher lows, volume and volatility is coming down. If we added Bollinger Bands to this chart, we would see the bands begin to narrow, indicating that at some point we can expect volatility to expect. It doesn’t necessarily mean that that volatility will be to the upside, but by playing the cards in front of us we can see the stock is uptrending.
I intend to add to my position here on a break of the recent high. I also notice this stock made the SNAPS, so it could be that more and more are becoming aware of the stock, helpfully to push the price of our merchandise up.
Atalaya Mining
Another stock that looks interesting is Atalaya Mining (ATYM). Here is the chart.
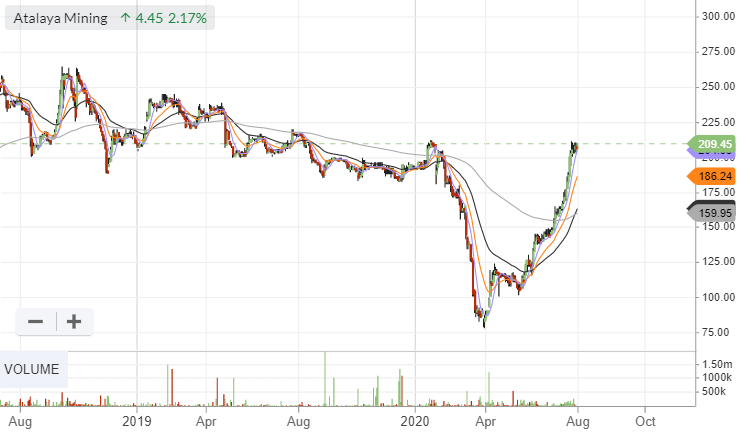
It’s made a sharp recovery since end of the March, and it’s now banging on the door of its 52 week high.
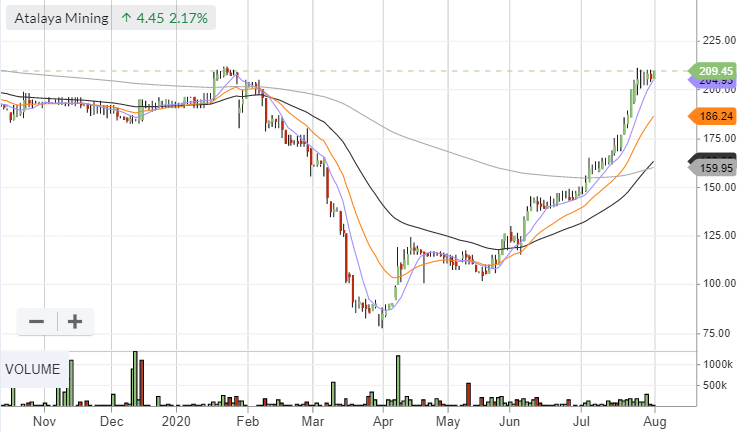
To me, this stock is looking extended. It’s risen quickly without pausing for breath. Now we’re at resistance, surely there must be some profit takers looking to lighten up?
That could explain the potential sideways action in recent days, but notice that volume has increased on the days where the stock has risen quickly.
There is clear accumulation here, so that’s a bonus.
I’ve dummy tested what’s available and being offered by the market makers, and they’re offering 209-210p but bidding in size at 204p. That could change in a single trade, of course, and so it means little on its own – but if after each trade the market makers are consistently bidding then it could mean they are positioned to take the stock higher.
Remember, market makers will take the price where it suits them, and what suits them (most of the time) is pandering to the market’s supply and demand (I say most of the time as sometimes they will tree shake and refuse to bid or offer any size whatsoever).
I’m going to watch Atalaya Mining, as if there is a keen bidder and it breaks out then it could continue on its path upwards.
You can download your copies of Michael’s books at www.shiftingshares.com
Twitter: @shiftingshares
Disclaimer
This is not financial advice. Our content is intended to be used and must be used for information and education purposes only. Please read our disclaimer and terms and conditions to understand our obligations.
7 comments
More great education Michael..Brilliant.
I had an £ATYM buying spree back in 2017 and it has been an absolute dog but am happy now that it has left my kennel. My target is 240 -250 pence so buy now and help me out!
Silver
For the less familiar, like me, a reminder somewhere of the coloured line codes would add even more to a helpful anaysis. Thanks.
Paul wrote a comment on Intercede yesterday & he disclosed that he had a holding may have resulted in the rise you mentioned in your article.
Hi Michael. Can I ask you whether you ever consider any of the statistical indicators like RSI etc.? I’ve pasted some of the Stockopedia ones (picked randomly) for Atalaya (but think the picture for WINE is similar) broadly showing the share more toward ‘overbought’. Does that actually encourage you and you just have to accept that if some stock is near an ATH? Do you ever look at the indicators to find other investment opportunities (i.e. looking for ones more ‘oversold’) or do you mainly focus on the chart patterns and volumes?
another great article by the way?
sorry, mean’t to finish with a ! not a ?, too late to edit... clumsy fingers.