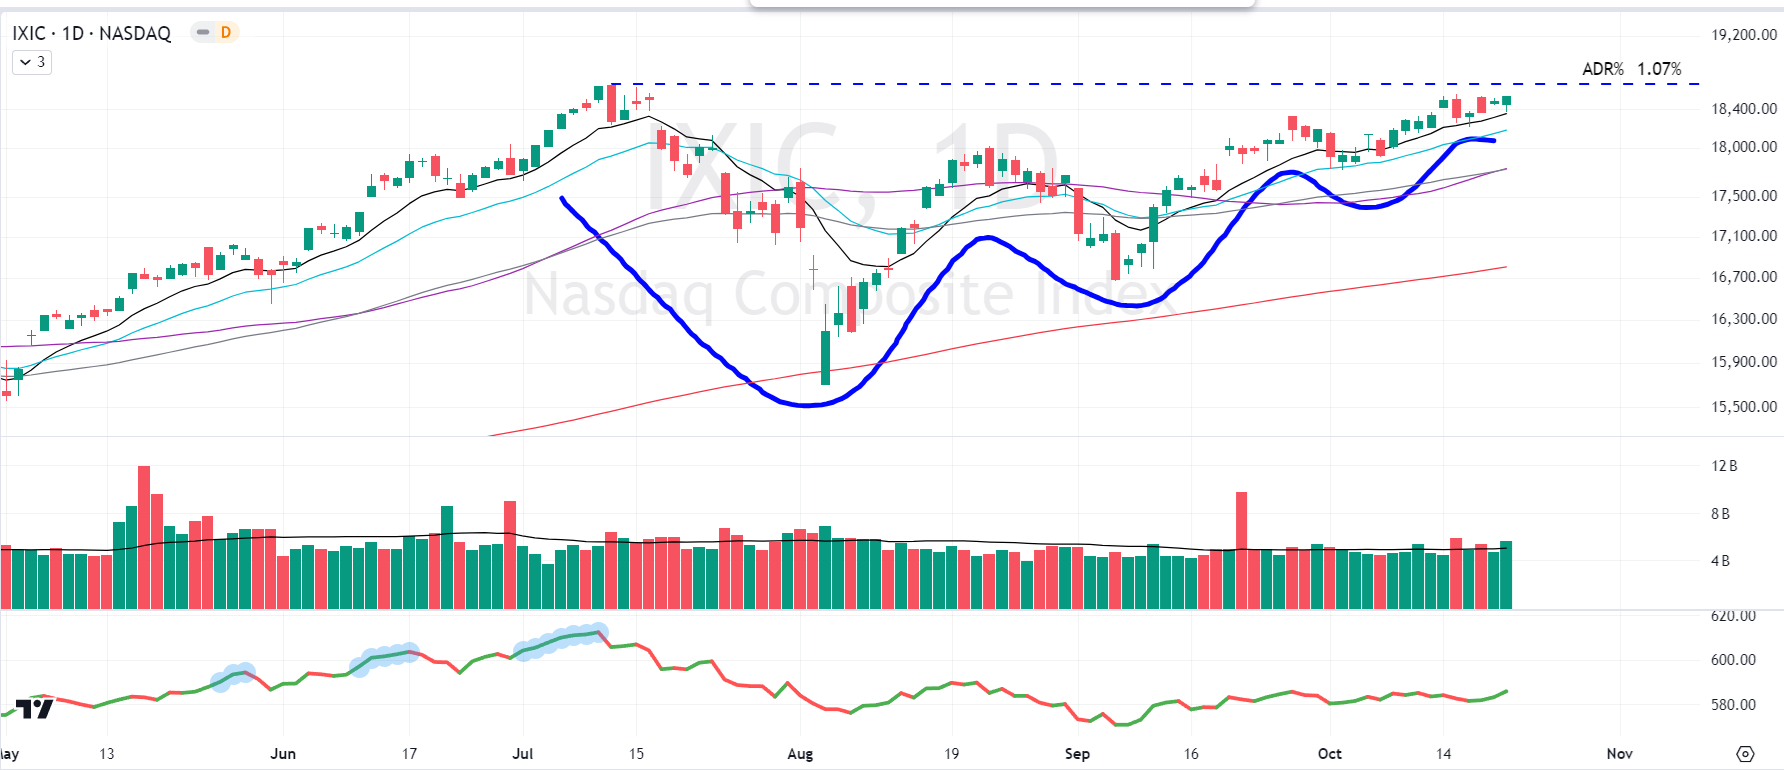
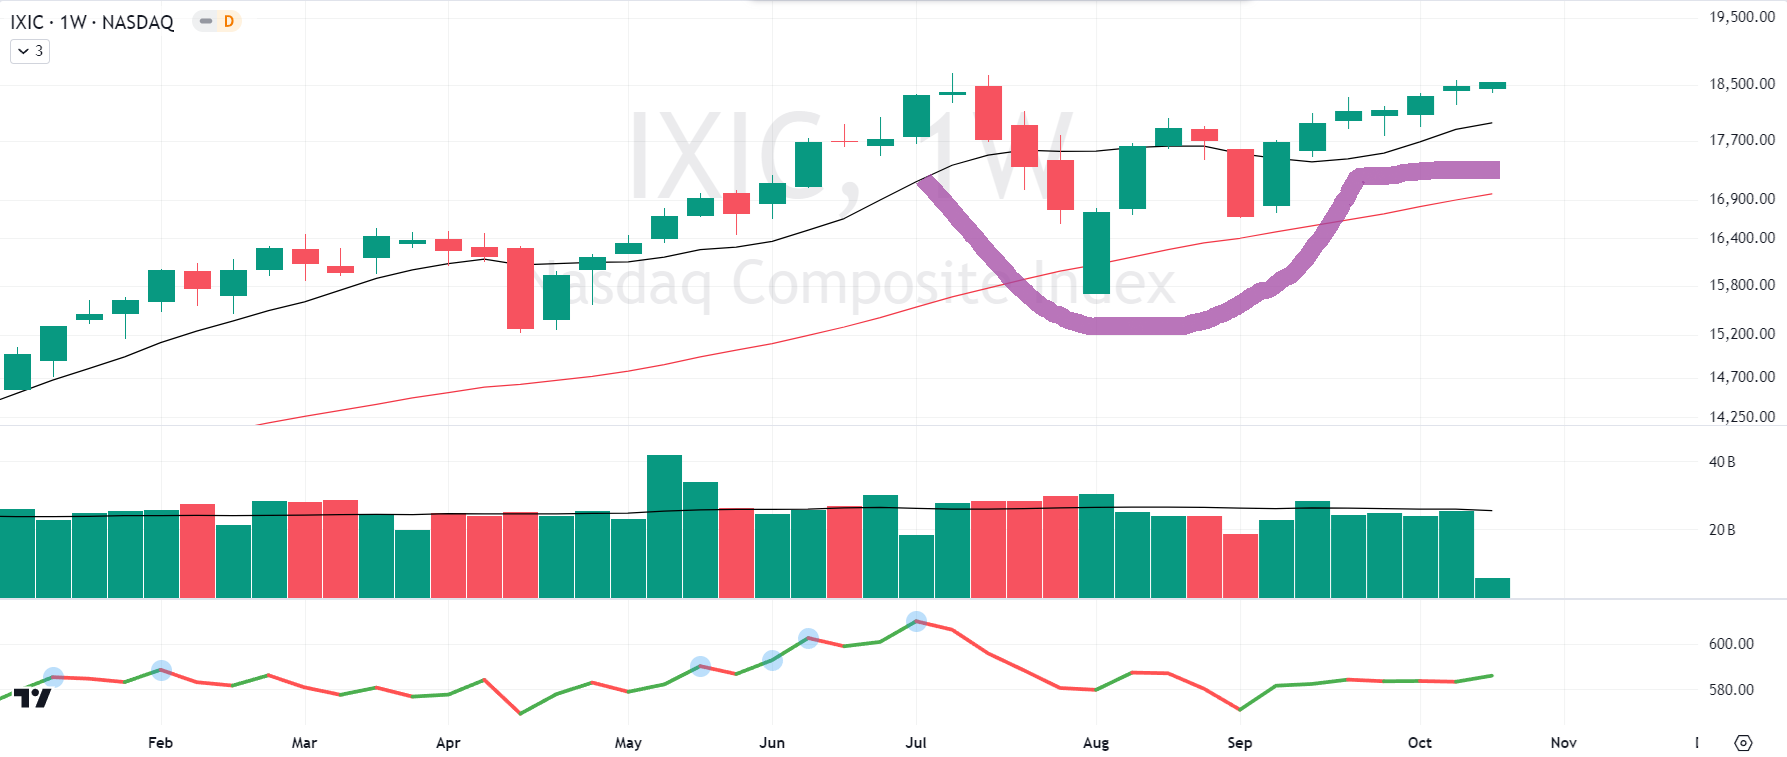
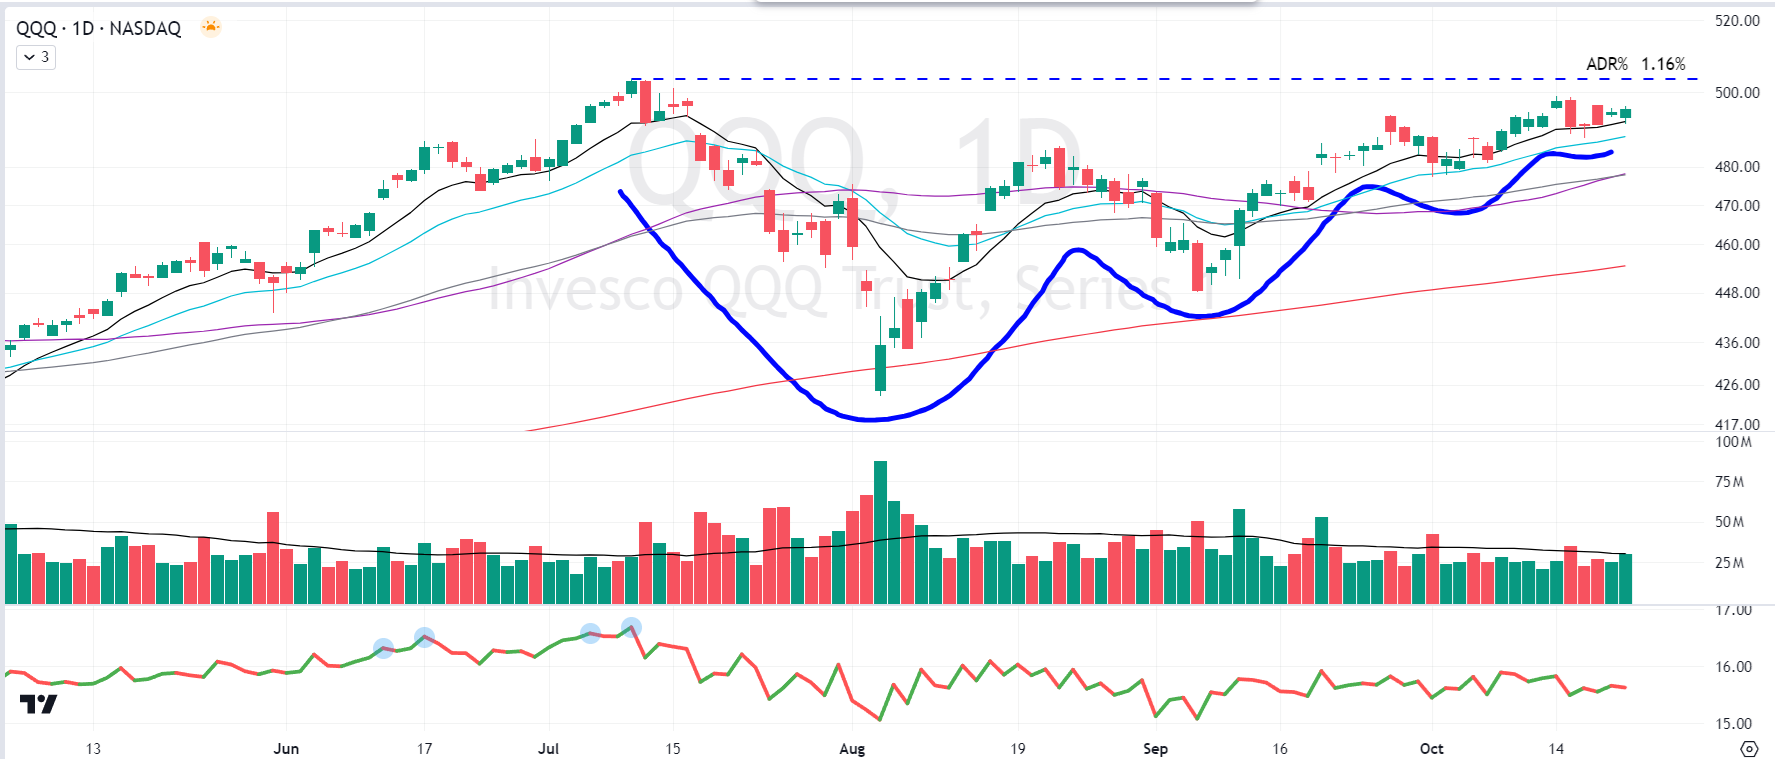
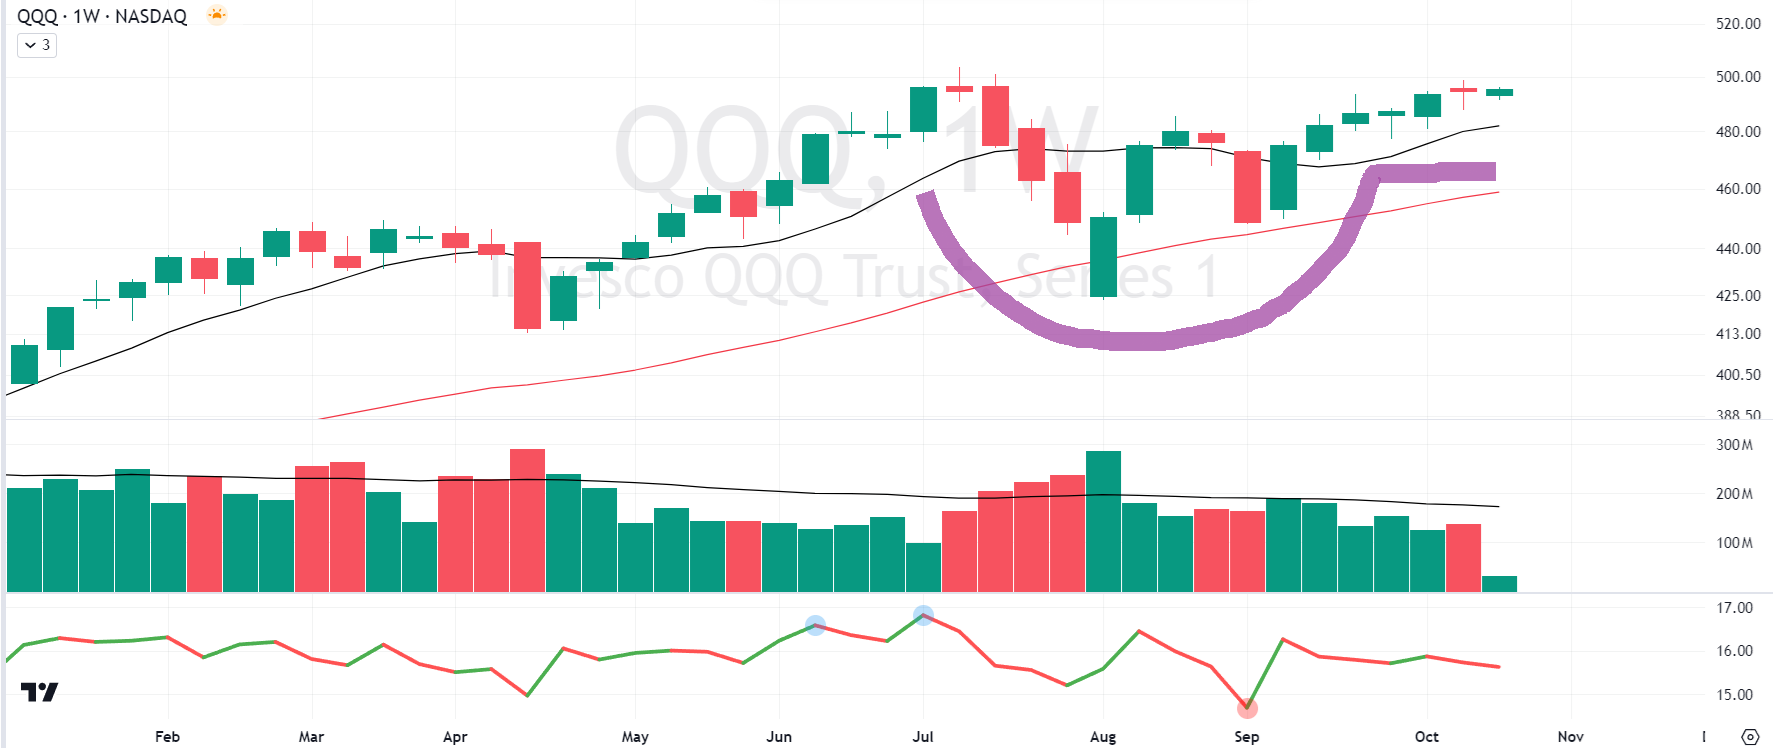
Daily charts of the QQQ & IXIC have potential for multi-month Volatility Contraction Patterns (VCPs) under all-time highs which started in July 2024. The weekly charts of QQQ & IXIC resemble Double Bottoms which are now morphing into Cup with Handles. Again, the context of under all-time highs.
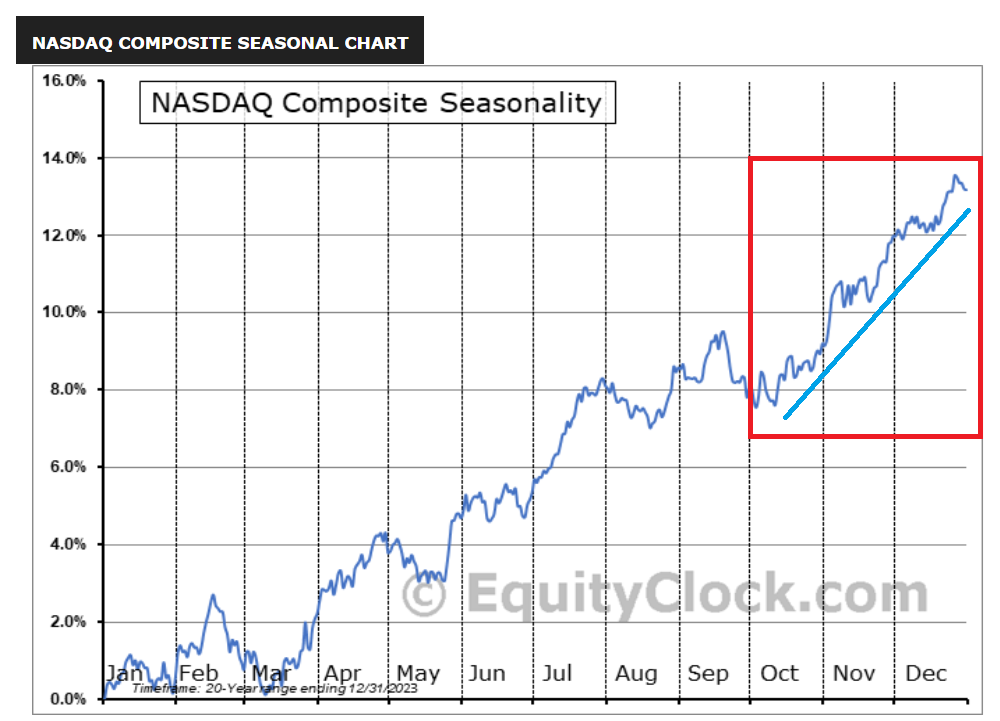
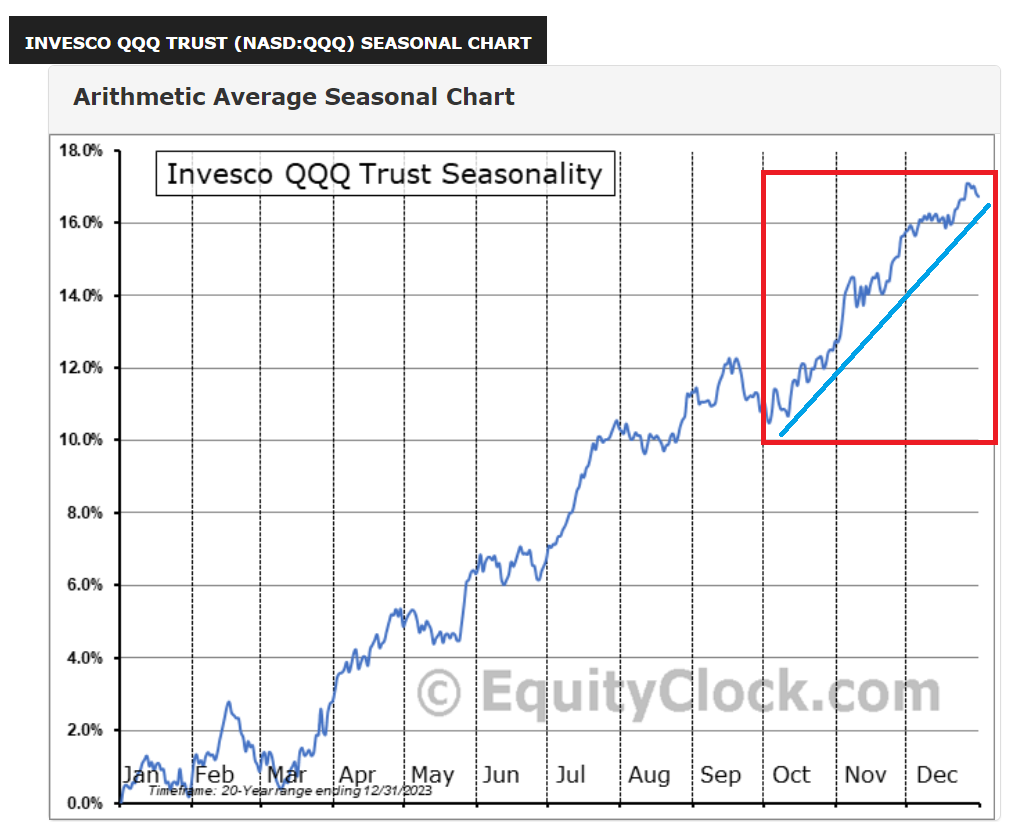
What makes this more interesting is from a 20-year seasonality perspective, QQQ & IXIC have performed well from the middle of October through December.
Therefore, it would seem plausible by year-end to see breakouts from these multi-month continuation bases for QQQ & IXIC if the 20-year seasonality trend plays out.
Moreover, there's no shortage of leadership stocks in the market around all-time highs which is a constructive sign. Whether that be mega caps leaders such as NVIDIA (NSQ:NVDA) Meta Platforms (NSQ:META) and Broadcom (NSQ:AVGO) or newer CAN SLIM stocks like Cava (NYQ:CAVA) Duolingo (NSQ:DUOL) and Palantir Technologies (NYQ:PLTR) .
Interesting times ahead!
QQQ (Nasdaq 100 proxy)
IXIC (Nasdaq Composite)